What Is a Triangle?
A triangle is a chart pattern, depicted by drawing trendlines along a converging price range, that connotes a pause in the prevailing trend. Technical analysts categorize triangles as continuation patterns.
KEY TAKEAWAYS
In technical analysis, a triangle is a continuation pattern on a chart that forms a triangle-like shape.
Triangles are similar to wedges and pennants and can be either a continuation pattern, if validated, or a powerful reversal pattern, in the event of failure.
There are three potential triangle variations that can develop as price action carves out a holding pattern, namely ascending, descending, and symmetrical triangles.
Type of Triangles
1/ Ascending Triangle: An ascending triangle is a breakout pattern that forms when the price breaches the upper horizontal trendline with rising volume. It is a bullish formation. The upper trendline must be horizontal, indicating nearly identical highs, which form a resistance level. The lower trendline is rising diagonally, indicating higher lows as buyers patiently step up their bids. Eventually, the buyers lose patience and rush into the security above the resistance price, which triggers more buying as the uptrend resumes. The upper trendline, which was formerly a resistance level, now becomes support.
2/ Descending Triangle: A descending triangle is an inverted version of the ascending triangle and considered a breakdown pattern. The lower trendline should be horizontal, connecting near identical lows. The upper trendline declines diagonally toward the apex. The breakdown occurs when the price collapses through the lower horizontal trendline support as a downtrend resumes. The lower trendline, which was support, now becomes resistance.
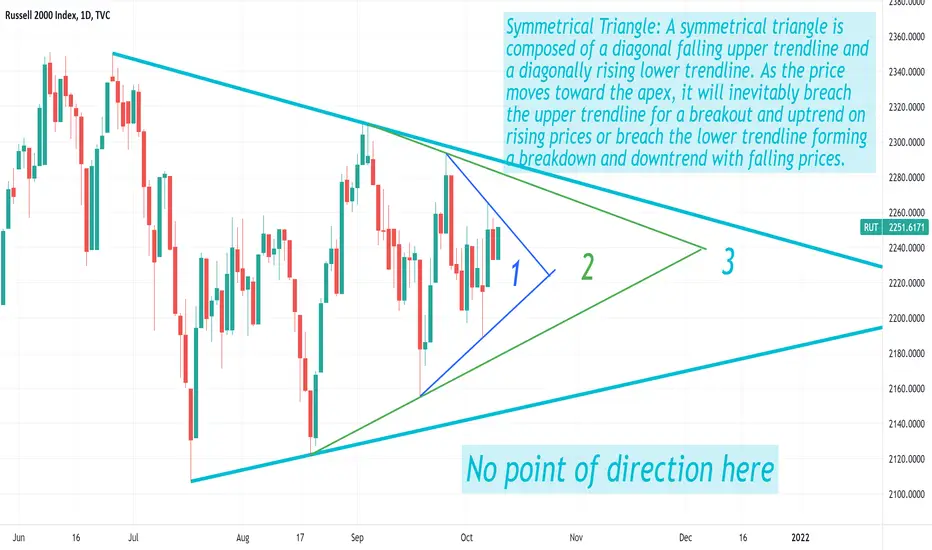
3/ Symmetrical Triangle: A symmetrical triangle is composed of a diagonal falling upper trendline and a diagonally rising lower trendline. As the price moves toward the apex, it will inevitably breach the upper trendline for a breakout and uptrend on rising prices or breach the lower trendline forming a breakdown and downtrend with falling prices.Traders should watch for a volume spike and at least two closes beyond the trendline to confirm the break is valid and not a head fake. Symmetrical triangles tend to be continuation break patterns, meaning that they tend to break in the direction of the initial move before the triangle formed. For example, if an uptrend precedes a symmetrical triangle, traders would expect the price to break to the upside.
A triangle is a chart pattern, depicted by drawing trendlines along a converging price range, that connotes a pause in the prevailing trend. Technical analysts categorize triangles as continuation patterns.
KEY TAKEAWAYS
In technical analysis, a triangle is a continuation pattern on a chart that forms a triangle-like shape.
Triangles are similar to wedges and pennants and can be either a continuation pattern, if validated, or a powerful reversal pattern, in the event of failure.
There are three potential triangle variations that can develop as price action carves out a holding pattern, namely ascending, descending, and symmetrical triangles.
Type of Triangles
1/ Ascending Triangle: An ascending triangle is a breakout pattern that forms when the price breaches the upper horizontal trendline with rising volume. It is a bullish formation. The upper trendline must be horizontal, indicating nearly identical highs, which form a resistance level. The lower trendline is rising diagonally, indicating higher lows as buyers patiently step up their bids. Eventually, the buyers lose patience and rush into the security above the resistance price, which triggers more buying as the uptrend resumes. The upper trendline, which was formerly a resistance level, now becomes support.
2/ Descending Triangle: A descending triangle is an inverted version of the ascending triangle and considered a breakdown pattern. The lower trendline should be horizontal, connecting near identical lows. The upper trendline declines diagonally toward the apex. The breakdown occurs when the price collapses through the lower horizontal trendline support as a downtrend resumes. The lower trendline, which was support, now becomes resistance.
3/ Symmetrical Triangle: A symmetrical triangle is composed of a diagonal falling upper trendline and a diagonally rising lower trendline. As the price moves toward the apex, it will inevitably breach the upper trendline for a breakout and uptrend on rising prices or breach the lower trendline forming a breakdown and downtrend with falling prices.Traders should watch for a volume spike and at least two closes beyond the trendline to confirm the break is valid and not a head fake. Symmetrical triangles tend to be continuation break patterns, meaning that they tend to break in the direction of the initial move before the triangle formed. For example, if an uptrend precedes a symmetrical triangle, traders would expect the price to break to the upside.
I do more in depth studies of stocks on my twitter account. Hope you would enjoy it there as you are enjoying it here.
****** Past performance is no guarantee of future results***
twitter.com/samitrading1
****** Past performance is no guarantee of future results***
twitter.com/samitrading1
Disclaimer
The information and publications are not meant to be, and do not constitute, financial, investment, trading, or other types of advice or recommendations supplied or endorsed by TradingView. Read more in the Terms of Use.