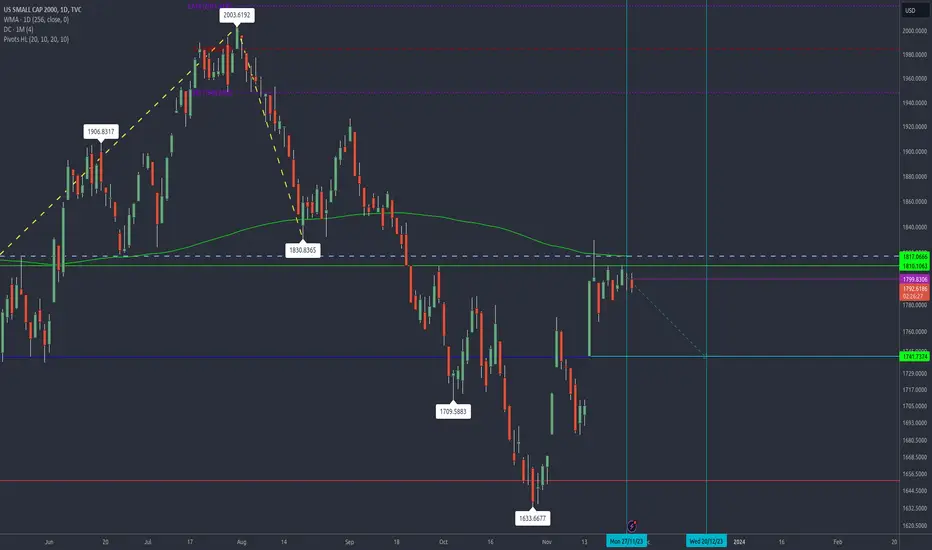
We have stopped at a former triple bottom which has been tested as a resistance twice now already.
So it may become a double top now. This the more that it was a top on May 23rd already.
The Moving Average is another resistance.
On November 14th we have opened window that may want to be closed.
Mind the trading range from mid March to 20th May which you can see easily in the weekly chart. It marks the top of today as well as the possible correction level.
We can say that the index has corrected the fall from end of July until 23rd October now and is back in its previous trading range.
This range may hold till the end of the year.
Trade closed: stop reached
Trade active
I'm going short again as the resistance held.Trade closed: target reached
I am taking profit meanwhile but intend to sell it once more if the price stops below the MA.Disclaimer
The information and publications are not meant to be, and do not constitute, financial, investment, trading, or other types of advice or recommendations supplied or endorsed by TradingView. Read more in the Terms of Use.
Disclaimer
The information and publications are not meant to be, and do not constitute, financial, investment, trading, or other types of advice or recommendations supplied or endorsed by TradingView. Read more in the Terms of Use.