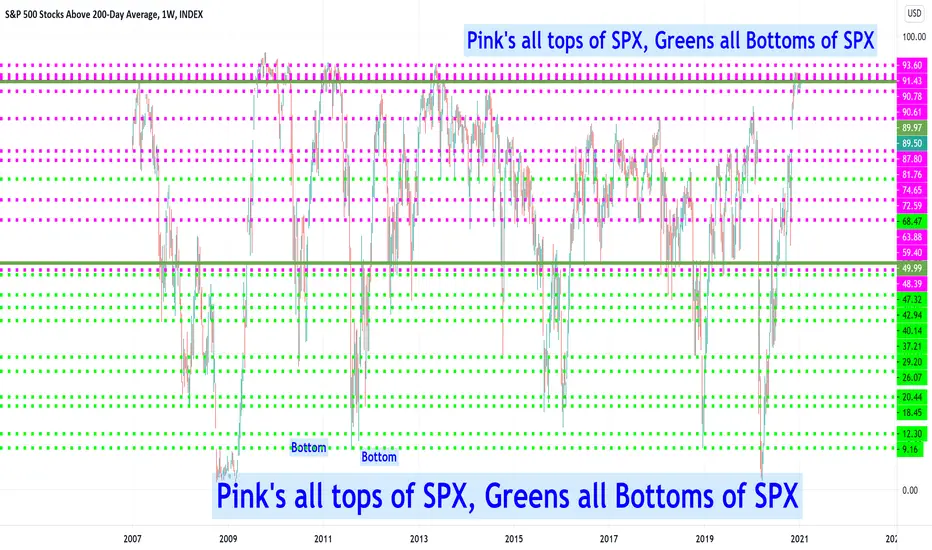
Nothing out of the usual here. Just a quick illustration about where did the tops and bottoms occurred. Each line represent an index reading either a top of spx of a bottom of spx. We did have a top with 49% reading !!! and a bottom with 81% reading these are the most extremes readings and we've never seen them again!!!
wish you all the best.
wish you all the best.
I do more in depth studies of stocks on my twitter account. Hope you would enjoy it there as you are enjoying it here.
****** Past performance is no guarantee of future results***
twitter.com/samitrading1
****** Past performance is no guarantee of future results***
twitter.com/samitrading1
Disclaimer
The information and publications are not meant to be, and do not constitute, financial, investment, trading, or other types of advice or recommendations supplied or endorsed by TradingView. Read more in the Terms of Use.