S&P 500 | Short-Term Breadth Signal | (April 27, 2025)
1️⃣ Insight Summary:
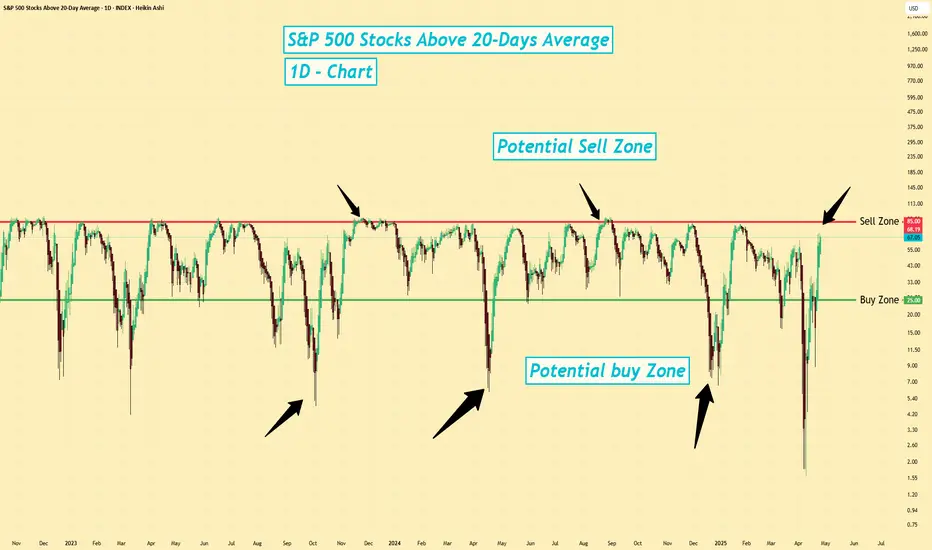
The S&P 500 percentage of stocks above the 20-day moving average is dropping sharply. This indicator is a great tool to catch local extremes — and right now, it’s flashing an important signal.
2️⃣ Market Setup:
🔻 Sell / Open Short Zones:
When this indicator pushes above 85–90% (marked in red), the market tends to be overheated. Historically, after these levels, corrections often follow.
🟢 Buy / Open Long Zones:
When the indicator falls below 20–25% (marked in green), the market becomes oversold. Pressure builds up, and probability for a bounce increases.
❌ Always be careful: in strong bear trends, oversold readings can stay extended longer than expected — so confirm structure before entering heavily.
4️⃣ Follow-up:
I will be closely watching for confirmation signs like a reversal in breadth and price stabilization before committing more to long setups.
Please LIKE 👍, FOLLOW ✅, SHARE 🙌 and COMMENT ✍ if you enjoy this idea! Also share your ideas and charts in the comments section below! This is best way to keep it relevant, support us, keep the content here free and allow the idea to reach as many people as possible.
Disclaimer: This is not financial advice. Always conduct your own research. This content may include enhancements made using AI.
1️⃣ Insight Summary:
The S&P 500 percentage of stocks above the 20-day moving average is dropping sharply. This indicator is a great tool to catch local extremes — and right now, it’s flashing an important signal.
2️⃣ Market Setup:
🔻 Sell / Open Short Zones:
When this indicator pushes above 85–90% (marked in red), the market tends to be overheated. Historically, after these levels, corrections often follow.
🟢 Buy / Open Long Zones:
When the indicator falls below 20–25% (marked in green), the market becomes oversold. Pressure builds up, and probability for a bounce increases.
❌ Always be careful: in strong bear trends, oversold readings can stay extended longer than expected — so confirm structure before entering heavily.
4️⃣ Follow-up:
I will be closely watching for confirmation signs like a reversal in breadth and price stabilization before committing more to long setups.
Please LIKE 👍, FOLLOW ✅, SHARE 🙌 and COMMENT ✍ if you enjoy this idea! Also share your ideas and charts in the comments section below! This is best way to keep it relevant, support us, keep the content here free and allow the idea to reach as many people as possible.
Disclaimer: This is not financial advice. Always conduct your own research. This content may include enhancements made using AI.
2 Ways I can help you | Real Trades. Real Edge
1️⃣ The 4 Steps to Improve Your Trading Immediately: tradinggen.services/mohamad-link/
2️⃣ Get trade setups & breakdowns Here: t.me/TradeSimple_with_Mo
1️⃣ The 4 Steps to Improve Your Trading Immediately: tradinggen.services/mohamad-link/
2️⃣ Get trade setups & breakdowns Here: t.me/TradeSimple_with_Mo
Disclaimer
The information and publications are not meant to be, and do not constitute, financial, investment, trading, or other types of advice or recommendations supplied or endorsed by TradingView. Read more in the Terms of Use.