🧠 Overview:
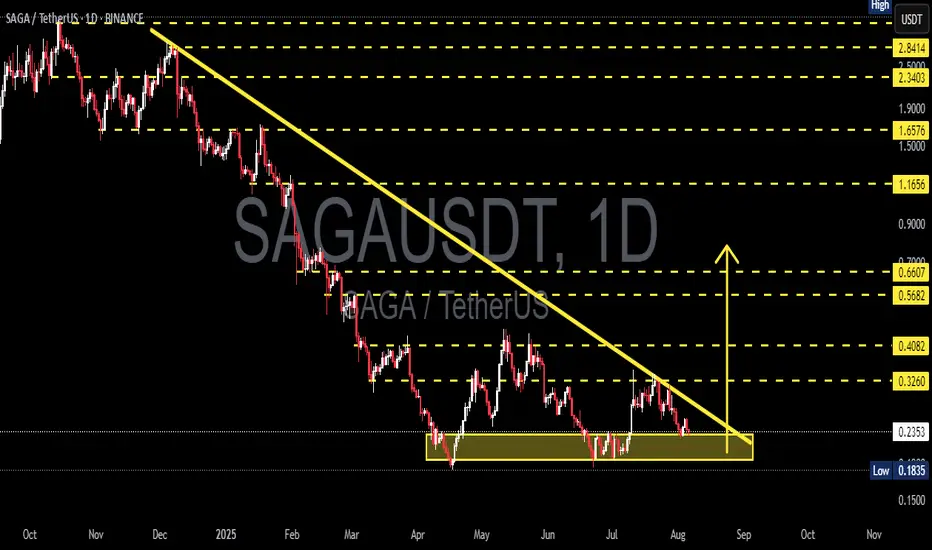
SAGA/USDT has been forming a Descending Triangle pattern for nearly 6 months, reflecting sustained selling pressure while maintaining strong horizontal support between $0.2352 – $0.1835. The price is now approaching the apex of the triangle, suggesting that a major move is imminent — either a bullish breakout or a bearish breakdown.
This setup is a classic “make or break” moment that often precedes explosive price action.
---
🔍 Technical Pattern: Descending Triangle
Dynamic Resistance: Lower highs forming a clear downtrend since February 2025.
Strong Support: The base of the triangle is solidified in the $0.2352–$0.1835 zone, which has been tested multiple times.
This pattern shows increasing sell pressure, but also persistent buyer defense — tension is rising.
---
🟢 Bullish Scenario: Breakout and Trend Reversal?
A confirmed breakout above the descending trendline and resistance at $0.3260 would signal a potential trend reversal and the start of bullish momentum.
📌 Bullish Target Levels:
1. $0.4082 – first local resistance
2. $0.5682 – volume-heavy area
3. $0.6607 – measured breakout target
4. $1.1656 – medium-term resistance
5. $1.6576 to $2.34 – possible if strong altcoin rally occurs
📈 Bullish Confirmation Signals:
Strong bullish candle close above trendline
Significant volume spike
RSI bouncing from neutral or oversold area
---
🔴 Bearish Scenario: Breakdown from Support
If the price breaks below $0.2352 and fails to hold the critical level at $0.1835, it may trigger a deeper continuation of the long-term downtrend.
📌 Bearish Target Zones:
$0.1500 psychological level
Possibly lower, depending on macro sentiment
⚠️ Caution:
Watch out for false breakdowns — wait for daily candle confirmation before reacting emotionally.
---
📊 Strategic Summary:
SAGA is at a critical inflection point — either it breaks out to reverse the trend or continues the downtrend with new lows. While descending triangles are typically bearish patterns, bullish breakouts can invalidate the structure, especially if supported by volume and sentiment.
💡 Pro Tip:
Always wait for daily candle close confirmation
Use RSI/MACD to confirm momentum shifts
Set tight stop-losses, especially near support/resistance
#SAGAUSDT #CryptoAnalysis #TechnicalBreakout #DescendingTriangle #BullishSetup #Altcoins #TrendReversal #CryptoChart #BreakoutWatch #VolumeAnalysis #PriceAction
✅ Get Free Signals! Join Our Telegram Channel Here: t.me/TheCryptoNuclear
✅ Twitter: twitter.com/crypto_nuclear
✅ Join Bybit : partner.bybit.com/b/nuclearvip
✅ Benefits : Lifetime Trading Fee Discount -50%
✅ Twitter: twitter.com/crypto_nuclear
✅ Join Bybit : partner.bybit.com/b/nuclearvip
✅ Benefits : Lifetime Trading Fee Discount -50%
Disclaimer
The information and publications are not meant to be, and do not constitute, financial, investment, trading, or other types of advice or recommendations supplied or endorsed by TradingView. Read more in the Terms of Use.