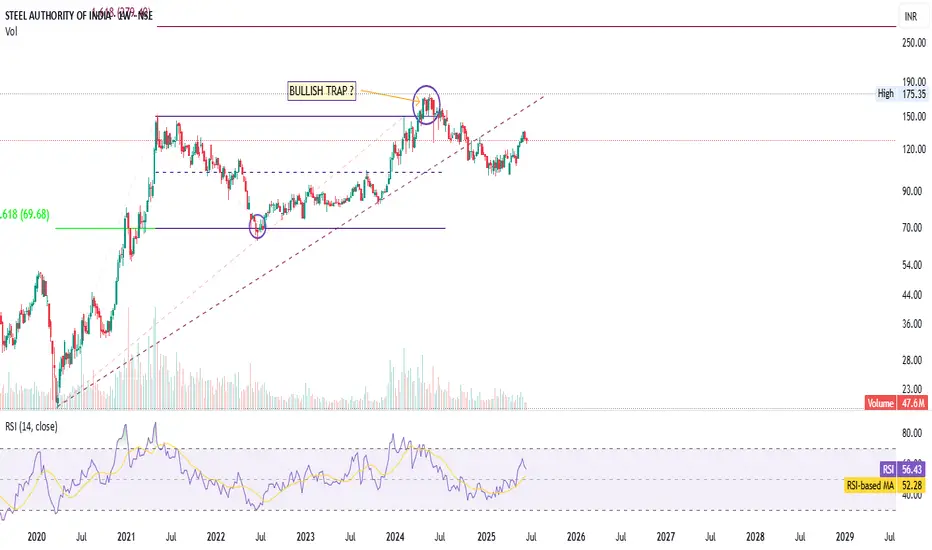
High at ₹175.35 marked — confirmed historical resistance.
Fibonacci 0.618 retracement level at ₹69.68 — acted as a key support in the past.
Important demand zone retest (marked in purple) was successful and led to the current uptrend.
2. Bullish Trap Highlighted:
The marked "Bullish Trap?" zone shows a classic false breakout above previous highs, followed by a reversal —
Volume also dropped after this area, supporting the trap hypothesis.
3. Trendlines:
Ascending dotted trendline is respected and acted as a pivot for recent price action.
Good visual use of multi-year structure with clean diagonals.
4. RSI Analysis:
RSI at 56.43 is trending upward and above its MA (52.28) → confirms bullish momentum.
Previously RSI bounced from sub-40 zones → indicating bottoming structure.
5. Volume Analysis:
Spikes in volume correlate with bottoms, confirming accumulation activity.
🧾 Summary
SAIL appears to have completed a bullish trap at around ₹175 and went into a corrective phase.
Found strong support at the long-term trendline and 0.618 Fib level (₹69.68).
Current structure is rebounding from higher low, forming a potential new base.
RSI and price action confirm renewed strength — trend resumption is likely
Disclaimer
The information and publications are not meant to be, and do not constitute, financial, investment, trading, or other types of advice or recommendations supplied or endorsed by TradingView. Read more in the Terms of Use.
Disclaimer
The information and publications are not meant to be, and do not constitute, financial, investment, trading, or other types of advice or recommendations supplied or endorsed by TradingView. Read more in the Terms of Use.