Updated
Salt - Breaking out! Lots of Potential
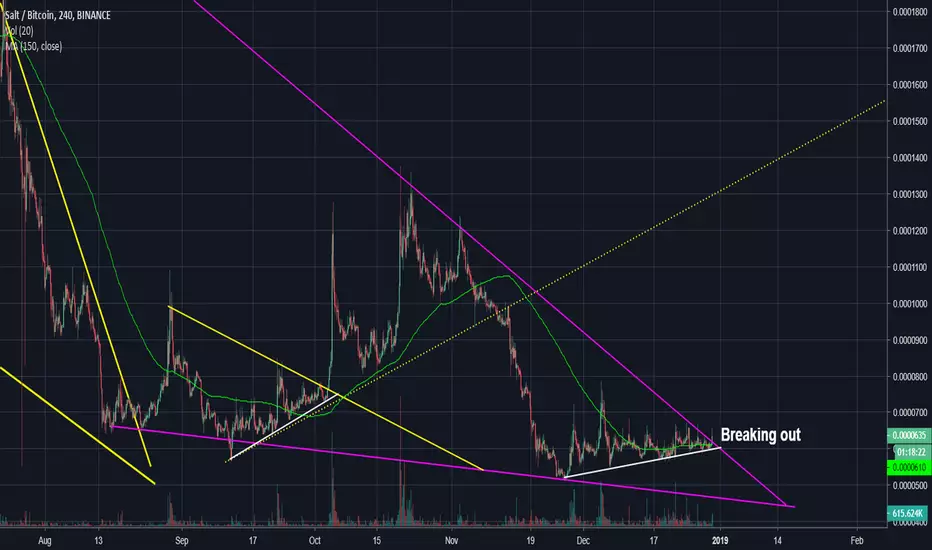
Looking at Salt's 4-hour chart, we can see it has been in an uptrend since late November and is currently testing the upper resistance boundary. It has already broken resistance and has since retraced. However, if the price takes off, there is a ton of potential.
Note
Here's something interesting I found. OBV stands for On Balance Volume and the theory behind it is that volume precedes price. On this chart, you can see that while the price is hitting lower lows, the OBV is hitting higher highs. The white lines indicate the divergence in price and the OBV. This is a strong bullish indicator that the price will soon follow the volume.
Note
The whales are loading up!
Disclaimer
The information and publications are not meant to be, and do not constitute, financial, investment, trading, or other types of advice or recommendations supplied or endorsed by TradingView. Read more in the Terms of Use.
Disclaimer
The information and publications are not meant to be, and do not constitute, financial, investment, trading, or other types of advice or recommendations supplied or endorsed by TradingView. Read more in the Terms of Use.