corrrection at 0.382
risk reward ratio is good
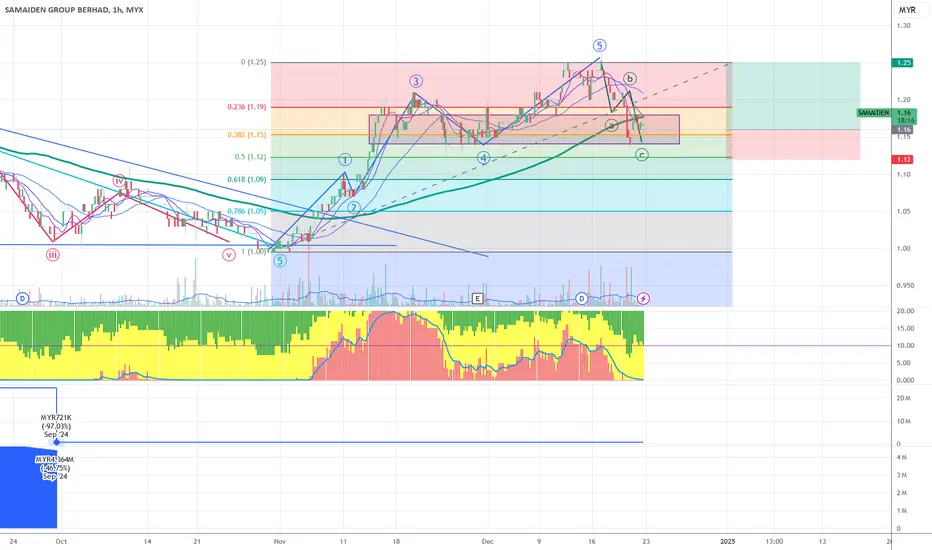
Here are the key elements I observe:
1. Price Movement:
- The chart shows candlestick patterns with both red and green candles
- Current price appears to be around 1.03 MYR (Malaysian Ringgit)
- There are multiple price levels marked with Fibonacci retracement levels (shown as horizontal lines)
2. Technical Indicators:
- Moving averages shown as curved lines in different colors
- Volume bars at the bottom of the chart (green and red bars)
- Various numbered points (1-5) marking significant price levels or movements
- Wave patterns labeled with roman numerals (iii, iv, v)
3. Trading Information:
- Buy level marked at 1.16
- Sell level marked at 1.15
- Target price shown as 0.09 (7.76%)
- Stop loss level appears to be set at 0.04 (3.45%)
- Risk/Reward ratio indicated as 2.25
4. Time Frame:
- The chart appears to be showing recent price action with data points marked for September 2024
- Volume analysis indicates varying levels of trading activity throughout the period
5. Market Status:
- The stock appears to be in a corrective phase after reaching a peak marked by point 5
- Multiple support and resistance levels are clearly marked on the chart
The overall chart seems to be a detailed technical analysis setup used for trading decisions with multiple indicators and price levels to guide entry and exit points.
risk reward ratio is good
Here are the key elements I observe:
1. Price Movement:
- The chart shows candlestick patterns with both red and green candles
- Current price appears to be around 1.03 MYR (Malaysian Ringgit)
- There are multiple price levels marked with Fibonacci retracement levels (shown as horizontal lines)
2. Technical Indicators:
- Moving averages shown as curved lines in different colors
- Volume bars at the bottom of the chart (green and red bars)
- Various numbered points (1-5) marking significant price levels or movements
- Wave patterns labeled with roman numerals (iii, iv, v)
3. Trading Information:
- Buy level marked at 1.16
- Sell level marked at 1.15
- Target price shown as 0.09 (7.76%)
- Stop loss level appears to be set at 0.04 (3.45%)
- Risk/Reward ratio indicated as 2.25
4. Time Frame:
- The chart appears to be showing recent price action with data points marked for September 2024
- Volume analysis indicates varying levels of trading activity throughout the period
5. Market Status:
- The stock appears to be in a corrective phase after reaching a peak marked by point 5
- Multiple support and resistance levels are clearly marked on the chart
The overall chart seems to be a detailed technical analysis setup used for trading decisions with multiple indicators and price levels to guide entry and exit points.
Disclaimer
The information and publications are not meant to be, and do not constitute, financial, investment, trading, or other types of advice or recommendations supplied or endorsed by TradingView. Read more in the Terms of Use.
Disclaimer
The information and publications are not meant to be, and do not constitute, financial, investment, trading, or other types of advice or recommendations supplied or endorsed by TradingView. Read more in the Terms of Use.