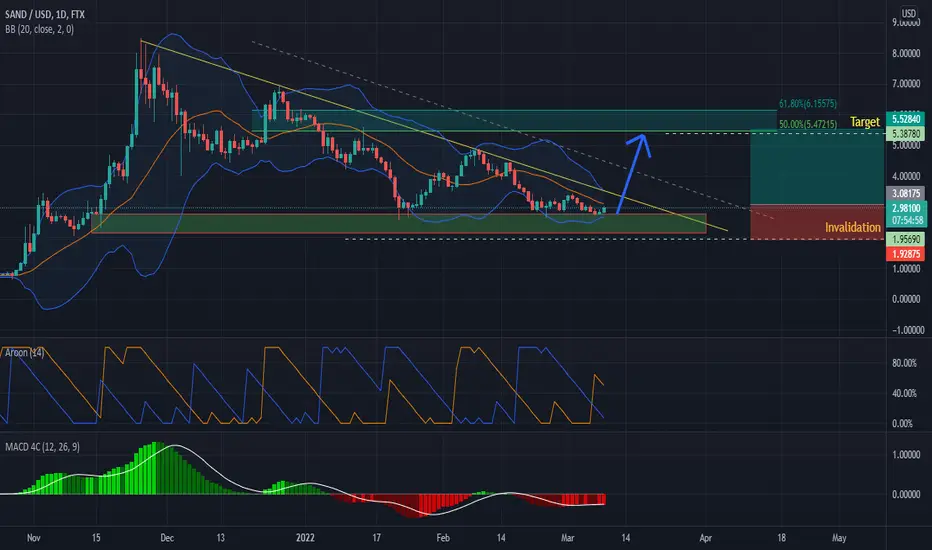
Sand bounced off of a support 3 times, and is at the end of a flag pattern, after break out we should see retracement to the 50% fib zone.
Aroon: On a daily time frame we see orange line crossed a blue one which shows start of a bullish trend.
MACD: We are already seeing light red candles which indicates bullish movement gain.
Bollinger band: We just bounced off of a bottom Bollinger band which indicates bullish trends start.
Entry: 2.97
Invalidation: 1.95
Target: 5.38
💥 Free signals and ideas ➡ t.me/vfinvestment
Disclaimer
The information and publications are not meant to be, and do not constitute, financial, investment, trading, or other types of advice or recommendations supplied or endorsed by TradingView. Read more in the Terms of Use.
💥 Free signals and ideas ➡ t.me/vfinvestment
Disclaimer
The information and publications are not meant to be, and do not constitute, financial, investment, trading, or other types of advice or recommendations supplied or endorsed by TradingView. Read more in the Terms of Use.