Shifting SAND' of Crypto: An In-depth Journey into the Sandbox
To begin, let's delve into understanding the fundamentals of SAND.
The Sandbox is an innovative, decentralized gaming platform that utilizes blockchain technology and non-fungible tokens (NFTs) to provide a unique play-to-earn model. This platform allows players to create digital assets, customize their own games and immerse themselves in an array of interactive hubs, environments, and experiences. Moreover, they can monetize their digital creations by selling them via the Sandbox Marketplace in exchange for the native cryptocurrency, SAND tokens.
The Sandbox universe is subdivided into 166,464 units of virtual real estate, referred to as LAND. Players can populate their LAND with games and ASSETS, or they can amalgamate several LANDs into larger estates. The ASSETS, or components of the virtual world, are categorized into entities and block ASSETS. Each of these ASSETS has a certain value in SAND and can be sold or traded at varying prices.
Having established the basic concept, let's shift our focus to the historical price trajectory of SAND.
SAND was launched on the OKX exchange on April 2nd, 2021, amidst an all-time high market for Bitcoin (BTC) and Ethereum (ETH). Post-launch, SAND underwent a substantial fall from its initial price of $0.7060 to $0.1740, marking a 75% decrease. Interestingly, this price level became a major structural low as it has not been revisited since.
Despite the downtrend of BTC and ETH, SAND broke the resistance level of $0.27 on July 4th, 2021. This shift sparked investor interest in alternative cryptocurrencies like SAND. Consequently, the token witnessed a remarkable 2650% surge within 150 days, averaging a day-to-day increase of 18.27%.
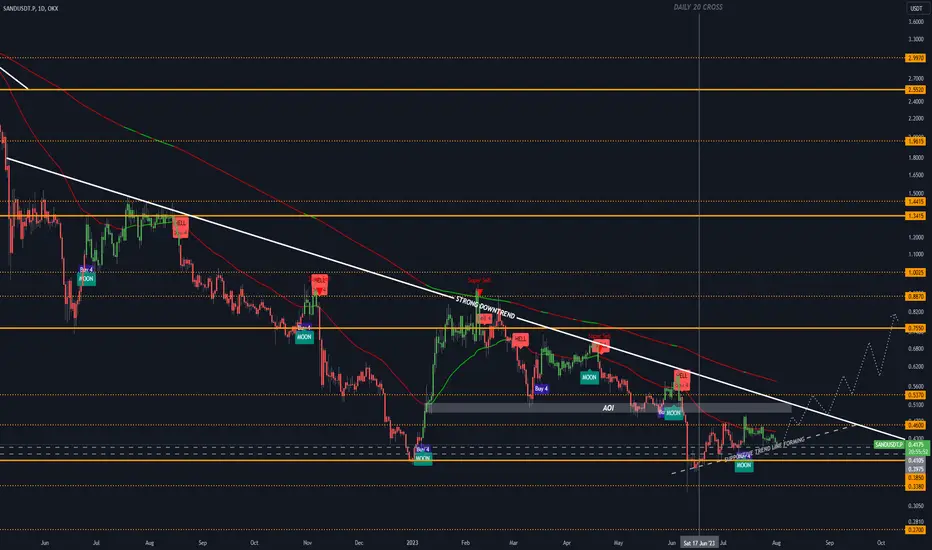
However, on November 25th, 2021, SAND reached its all-time high at $8.49 but failed to maintain above the critical support/resistance zone at $7.5125. As weaknesses began to appear across the industry, a downtrend ensued with the price plunging 70% over the following 150 days. Notably, the price frequently rebounded from the support/resistance level of $2.5520 until it was breached, leading to an additional 85% fall to the support level established in April 2021.
So, where does SAND stand today?
As of recent observations, after managing to hold above the major support/resistance zone at $.3850, SAND rallied to $.46 and above before encountering a substantial sell-off. It's important to note that a strong downtrend has been in place since May 10th, 2022. The most recent rally against this trend originated from the support level at $.3850, also forming an Area of Interest (AOI) ranging between $.4890 and $.52.
Furthermore, the emergence of a potential uptrend suggests that the price may have difficulty breaching the current resistance level at $.46.
Let's now consider the crucial technical indicators:
Both the 50-day and 200-day Exponential Moving Averages (EMAs) are currently bearish, with the price unable to breach the 50 EMA in its recent attempt. This, coupled with the downward trend of both EMAs, indicates a possibly bearish sentiment.
In terms of algorithmic trading, 2 out of 3 ROBO indicators currently suggest a bullish sentiment on the daily timeframe. Using these two indicators in tandem provides a neutral outlook, suggesting it might be prudent to wait for an optimal entry point for long positions.
What should we anticipate going forward?
For SAND to trend upwards, traders and investors will need to see a break above the current resistance level, which could alter market sentiment towards the project. Conversely, if SAND fails to do so and breaks the present daily uptrend, it may return to and possibly sweep past previous lows at $.4105 and $.3975, marking a 1.5 - 5% decline from the current price.
Should there be a market-wide sell-off for BTC and ETH, SAND could potentially test the major structural support at $.3850, which also serves as a crucial psychological level.
The Sandbox is an innovative, decentralized gaming platform that utilizes blockchain technology and non-fungible tokens (NFTs) to provide a unique play-to-earn model. This platform allows players to create digital assets, customize their own games and immerse themselves in an array of interactive hubs, environments, and experiences. Moreover, they can monetize their digital creations by selling them via the Sandbox Marketplace in exchange for the native cryptocurrency, SAND tokens.
The Sandbox universe is subdivided into 166,464 units of virtual real estate, referred to as LAND. Players can populate their LAND with games and ASSETS, or they can amalgamate several LANDs into larger estates. The ASSETS, or components of the virtual world, are categorized into entities and block ASSETS. Each of these ASSETS has a certain value in SAND and can be sold or traded at varying prices.
Having established the basic concept, let's shift our focus to the historical price trajectory of SAND.
SAND was launched on the OKX exchange on April 2nd, 2021, amidst an all-time high market for Bitcoin (BTC) and Ethereum (ETH). Post-launch, SAND underwent a substantial fall from its initial price of $0.7060 to $0.1740, marking a 75% decrease. Interestingly, this price level became a major structural low as it has not been revisited since.
Despite the downtrend of BTC and ETH, SAND broke the resistance level of $0.27 on July 4th, 2021. This shift sparked investor interest in alternative cryptocurrencies like SAND. Consequently, the token witnessed a remarkable 2650% surge within 150 days, averaging a day-to-day increase of 18.27%.
However, on November 25th, 2021, SAND reached its all-time high at $8.49 but failed to maintain above the critical support/resistance zone at $7.5125. As weaknesses began to appear across the industry, a downtrend ensued with the price plunging 70% over the following 150 days. Notably, the price frequently rebounded from the support/resistance level of $2.5520 until it was breached, leading to an additional 85% fall to the support level established in April 2021.
So, where does SAND stand today?
As of recent observations, after managing to hold above the major support/resistance zone at $.3850, SAND rallied to $.46 and above before encountering a substantial sell-off. It's important to note that a strong downtrend has been in place since May 10th, 2022. The most recent rally against this trend originated from the support level at $.3850, also forming an Area of Interest (AOI) ranging between $.4890 and $.52.
Furthermore, the emergence of a potential uptrend suggests that the price may have difficulty breaching the current resistance level at $.46.
Let's now consider the crucial technical indicators:
Both the 50-day and 200-day Exponential Moving Averages (EMAs) are currently bearish, with the price unable to breach the 50 EMA in its recent attempt. This, coupled with the downward trend of both EMAs, indicates a possibly bearish sentiment.
In terms of algorithmic trading, 2 out of 3 ROBO indicators currently suggest a bullish sentiment on the daily timeframe. Using these two indicators in tandem provides a neutral outlook, suggesting it might be prudent to wait for an optimal entry point for long positions.
What should we anticipate going forward?
For SAND to trend upwards, traders and investors will need to see a break above the current resistance level, which could alter market sentiment towards the project. Conversely, if SAND fails to do so and breaks the present daily uptrend, it may return to and possibly sweep past previous lows at $.4105 and $.3975, marking a 1.5 - 5% decline from the current price.
Should there be a market-wide sell-off for BTC and ETH, SAND could potentially test the major structural support at $.3850, which also serves as a crucial psychological level.
Note
$.3975 level as indicated acted as a support level.Disclaimer
The information and publications are not meant to be, and do not constitute, financial, investment, trading, or other types of advice or recommendations supplied or endorsed by TradingView. Read more in the Terms of Use.
Disclaimer
The information and publications are not meant to be, and do not constitute, financial, investment, trading, or other types of advice or recommendations supplied or endorsed by TradingView. Read more in the Terms of Use.