1. Market Structure:
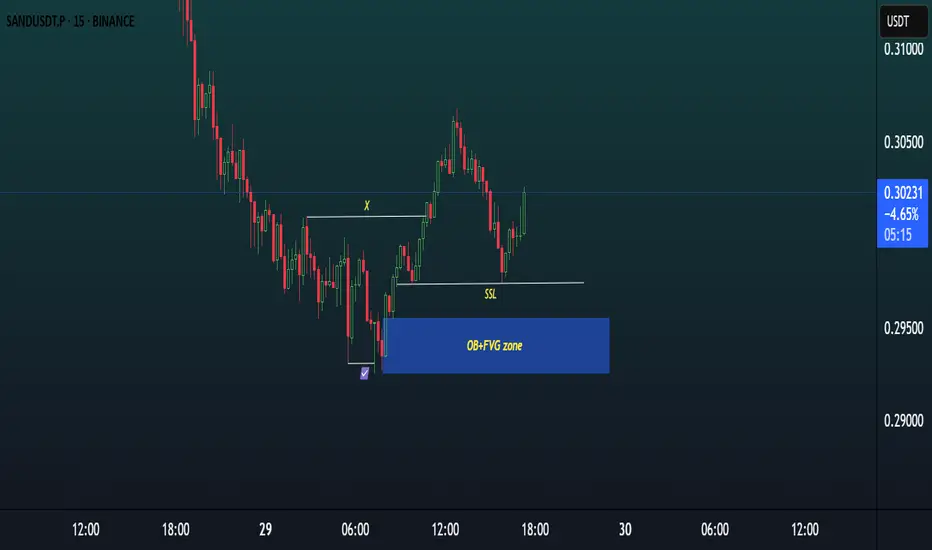
The chart shows a bullish market structure with a clear Break of Structure (BoS) to the upside (marked by “X”).
After this impulsive move, the price has entered a retracement phase, forming lower highs and lower lows within this short-term correction.
2. Liquidity Engineering:
Sell-Side Liquidity (SSL) is visible just below the 0.2980 level, formed by equal lows and previous swing lows.
This liquidity has not yet been swept, meaning the market may still target this area to grab liquidity before any strong bullish move.
3. Key Demand Zone – OB + FVG:
Below the SSL lies a strong demand zone, marked by a Bullish Order Block (OB) overlapping with a Fair Value Gap (FVG) in the 0.2940–0.2960 range.
This confluence increases the probability of a strong bullish reaction when price enters this zone.
4. Current Price Action:
Price is currently reacting around 0.3000, showing a minor bounce, but no key zone has been tapped yet.
As SSL is still intact and unmitigated, there is a high likelihood that price will first move lower to sweep the liquidity and tap into the OB + FVG zone.
5. Trade Expectation:
Ideal setup: Wait for price to sweep SSL, enter the OB + FVG zone, and then look for bullish confirmation (such as a bullish engulfing, change of character, or lower timeframe BOS) to consider a long position.
Stop Loss: Below the OB zone (~0.2930).
Take Profit: 1.5x to 2x RR, or targeting the recent high around 0.3060–0.3080.
6. Summary:
SAND/USDT is showing bullish intent, but is likely to first sweep sell-side liquidity and tap into the OB + FVG demand zone before resuming the uptrend. Patience is key — await a clean reaction and confirmation before entering long.
Disclaimer
The information and publications are not meant to be, and do not constitute, financial, investment, trading, or other types of advice or recommendations supplied or endorsed by TradingView. Read more in the Terms of Use.
Disclaimer
The information and publications are not meant to be, and do not constitute, financial, investment, trading, or other types of advice or recommendations supplied or endorsed by TradingView. Read more in the Terms of Use.