. Overall Trend and Price Patterns:
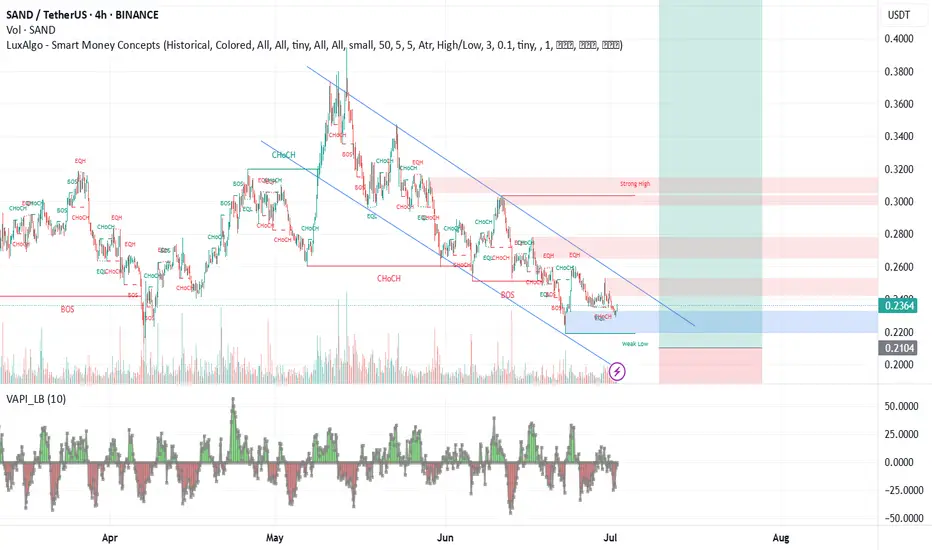
In the long and medium term, SAND's trend is bearish. This is confirmed by the 4-hour charts and higher, where lower highs and lower lows are observed. The "Smart Money Concept" indicator also indicates a "Trend: Negative".
A descending channel has been identified on the 4-hour chart, a bearish continuation pattern that suggests the price will continue to move downward within this channel. Previously, a descending triangle with similar bearish implications was considered.
2. Key Levels (Support and Resistance):
Resistance: Levels around $0.2484 (15m chart) and "Order Blocks" or "Supply Zones" (red-shaded areas) on the 1h and 4h charts.
Support: "Demand Zones" or "Order Blocks" (green/blue shaded areas) on the 1h and 4h charts, and the $0.2361 level (15m chart). The bottom line of the descending channel also acts as dynamic support.
3. Momentum Indicators and Moving Averages:
Short Term (30 min - 1 hour): Investing.com reports "Strong Buy" and the 5, 10, and 20-period Moving Averages show a "Buy" signal. Some oscillators like RSI, Ultimate Oscillator, and ROC are also indicating "Buy". This suggests a very recent bounce or bullish momentum.
Medium/Long Term (5 hours - Monthly): Investing.com reports "Strong Sell". The 100 and 200-period Moving Averages also show a "Sell" signal, confirming the bearish trend in these broader timeframes.
Warnings: Indicators like STOCHRSI, Williams %R, and CCI are in "Overbought" conditions on some timeframes, suggesting that the short-term bounce might be running out of steam and prone to a correction or bearish continuation.
4. Volume:
Volume has been significant during price declines, reinforcing selling pressure. Volume tends to decrease as the price approaches the apex of consolidation patterns.
5. Fund Flows (On-Chain):
Large transfers of SAND (over 1.8 million tokens) were observed leaving Upbit wallets to a specific address in the early hours of June 30, 2025. Such significant movements from exchanges can indicate potential future selling pressure or internal exchange movements.
Overall Conclusion:
While SAND has shown a slight bounce or bullish momentum in the very short timeframes (30 min - 1 hour), the dominant trend in the medium and long term remains bearish, confirmed by price patterns (descending channel), Smart Money Concepts analysis, and longer-duration moving averages. Indicators showing "overbought" conditions in smaller timeframes suggest that this bounce may not be sustainable in the long run and that the price could move downwards again to follow the main trend. Large token movements from Upbit add an element of uncertainty and potential selling pressure.
Disclaimer
The information and publications are not meant to be, and do not constitute, financial, investment, trading, or other types of advice or recommendations supplied or endorsed by TradingView. Read more in the Terms of Use.
Disclaimer
The information and publications are not meant to be, and do not constitute, financial, investment, trading, or other types of advice or recommendations supplied or endorsed by TradingView. Read more in the Terms of Use.