The following content is machine translated:
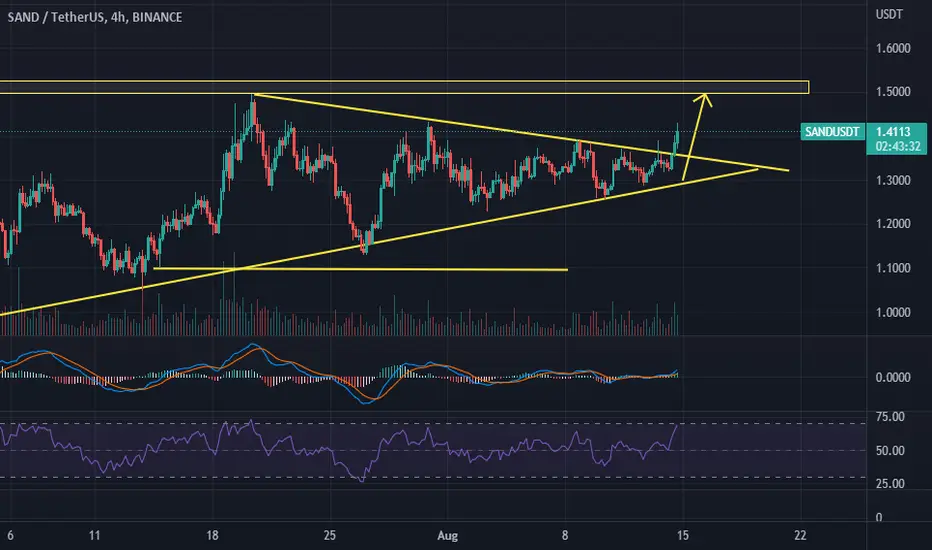
In the 4-hour chart, it fell back after yesterday's false breakthrough, and today it broke through successfully and continues to be bullish.
Indicators macd and RSI indicators are bullish trends.
Summary: The breakout pattern and indicators are both in the bullish range and continue to be bullish. The short-term target is to look at the resistance near 1.5, and the breakthrough continues to look at a higher position, such as near 2.
📈📉 Join our analysis channel,加入我们的频道:👇
t.me/CryptoObservation
📈📉 我们的中文电报社区:👇
t.me/CryptoMiningCN
☯️ 我们目前提供更高准确度的交易指引,请加入我们的电报社区后和管理员联系。☯️
t.me/CryptoObservation
📈📉 我们的中文电报社区:👇
t.me/CryptoMiningCN
☯️ 我们目前提供更高准确度的交易指引,请加入我们的电报社区后和管理员联系。☯️
Disclaimer
The information and publications are not meant to be, and do not constitute, financial, investment, trading, or other types of advice or recommendations supplied or endorsed by TradingView. Read more in the Terms of Use.