You can see the simplest and most efficient price actions in cryptocurrency charts.
The reason is that the capital available in this market is much less than a market like Forex. Always keep in mind that any market with more capital and traders will find it harder to trade.
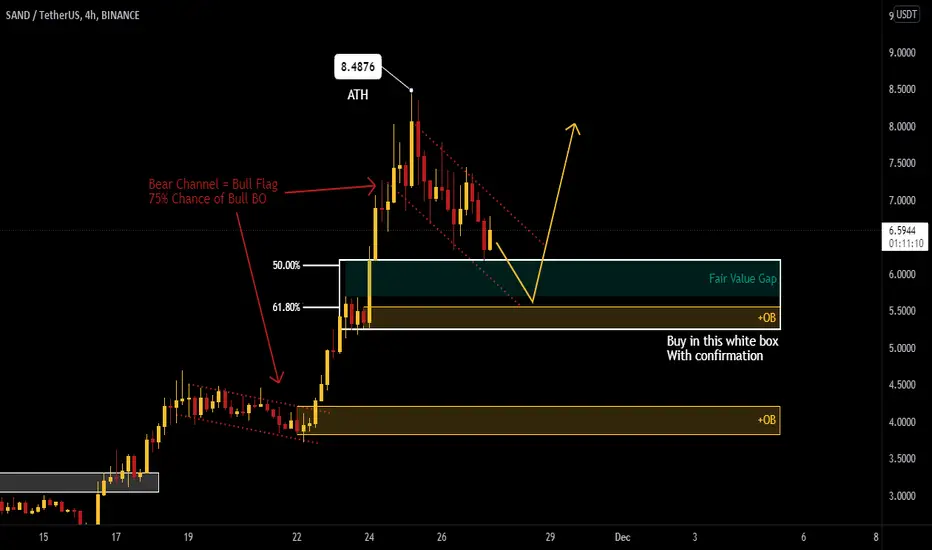
Let's go to the SAND analysis H4 timeframe:
We had strong bullish trend ( More Clear in Daily Timeframe ). We had a bull flag November 18 to November 21 which was a bulls consolidation too. Always remember to see all channels as flags. So bear channels are bull flags and have 75% chance of bull BO.
From current ATH ( $8.48 ) correction leg got started as bear channel. Bear channel is bull flag so we have to wait and enter when bulls come and bull flag get broken.
Marked area with white rectangle is combination of fair value gap + 50% and 61% Fibonacci levels + Bullish Orderblock. Given the possibilities, this area has great potential for buying.
But marking this area is not enough and you have to buy with good signal bars ( Strong Bullish Candle Close Near High ).
If this zone won't hold price, next target for bears will be lower Bullish Orderblock.
**This is not an investment advice. Your capital might be at risk.**
Give me your idea on comments...
Good Luck...
The reason is that the capital available in this market is much less than a market like Forex. Always keep in mind that any market with more capital and traders will find it harder to trade.
Let's go to the SAND analysis H4 timeframe:
We had strong bullish trend ( More Clear in Daily Timeframe ). We had a bull flag November 18 to November 21 which was a bulls consolidation too. Always remember to see all channels as flags. So bear channels are bull flags and have 75% chance of bull BO.
From current ATH ( $8.48 ) correction leg got started as bear channel. Bear channel is bull flag so we have to wait and enter when bulls come and bull flag get broken.
Marked area with white rectangle is combination of fair value gap + 50% and 61% Fibonacci levels + Bullish Orderblock. Given the possibilities, this area has great potential for buying.
But marking this area is not enough and you have to buy with good signal bars ( Strong Bullish Candle Close Near High ).
If this zone won't hold price, next target for bears will be lower Bullish Orderblock.
**This is not an investment advice. Your capital might be at risk.**
Give me your idea on comments...
Good Luck...
Trade active
About 40% profit from the zone I marked up😉🤙🏽Disclaimer
The information and publications are not meant to be, and do not constitute, financial, investment, trading, or other types of advice or recommendations supplied or endorsed by TradingView. Read more in the Terms of Use.
Disclaimer
The information and publications are not meant to be, and do not constitute, financial, investment, trading, or other types of advice or recommendations supplied or endorsed by TradingView. Read more in the Terms of Use.