Detailed Technical Analysis:
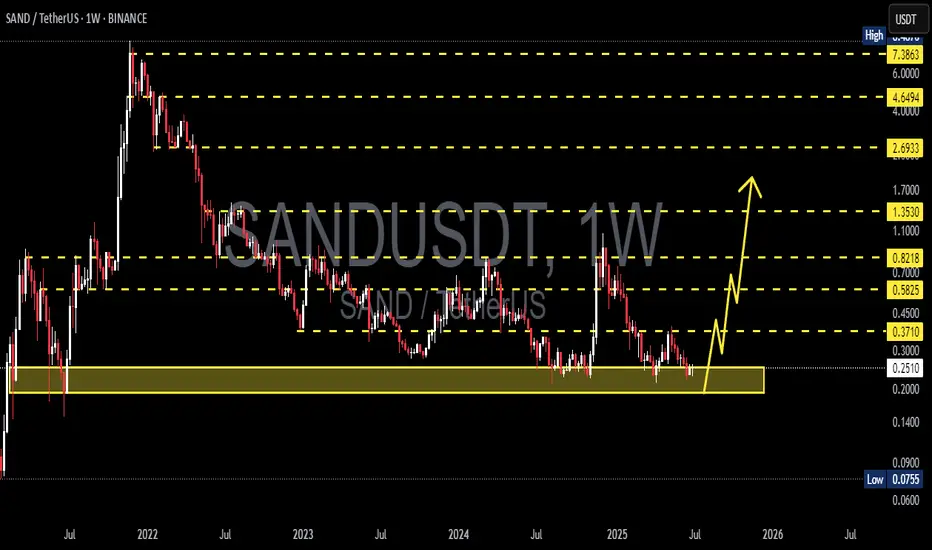
The SAND/USDT weekly chart shows the price currently hovering around a historically strong support zone between $0.20 – $0.25. This yellow-marked demand area has been tested multiple times since 2021 and has consistently prevented further downside, making it a crucial decision point for both bulls and bears.
🟢 Bullish Scenario:
If the price manages to hold this key support and prints bullish price action (e.g., a bullish engulfing or hammer candlestick), a reversal is likely. The projected upward path on the chart outlines the next key resistance levels:
1. $0.3710 – Initial resistance.
2. $0.4500 – First major breakout confirmation.
3. $0.5825 - $0.7000 – Mid-term resistance cluster.
4. $0.8218 - $1.3530 – Longer-term targets if bullish momentum sustains.
Bullish Confirmation:
Weekly candle close above $0.37
Breakout with strong volume beyond $0.45
🔴 Bearish Scenario:
If the price breaks below and closes under the $0.20 support zone, it would signal a bearish continuation, with possible downside targets at:
1. $0.14 – Minor historical support.
2. $0.09 - $0.075 – Extreme low support region and historical bottom.
Bearish Confirmation:
Weekly close below $0.20
Strong breakdown volume without immediate bullish rejection
📊 Chart Pattern Overview:
✅ Triple Bottom / Accumulation Zone:
The current support area resembles a potential triple bottom structure or long-term accumulation phase. If confirmed, this pattern could mark the beginning of a new bullish cycle.
🧠 Conclusion:
SAND is at a make-or-break level. As long as the price holds above the $0.20 - $0.25 support zone, bullish recovery remains a valid possibility. However, a breakdown below this level could trigger a significant bearish move.
#SANDUSDT #CryptoAnalysis #AltcoinSeason #TechnicalAnalysis #BullishScenario #BearishScenario #CryptoTrading #PriceAction #SupportResistance #TripleBottom
✅ Get Free Signals! Join Our Telegram Channel Here: t.me/TheCryptoNuclear
✅ Twitter: twitter.com/crypto_nuclear
✅ Join Bybit : partner.bybit.com/b/nuclearvip
✅ Benefits : Lifetime Trading Fee Discount -50%
✅ Twitter: twitter.com/crypto_nuclear
✅ Join Bybit : partner.bybit.com/b/nuclearvip
✅ Benefits : Lifetime Trading Fee Discount -50%
Disclaimer
The information and publications are not meant to be, and do not constitute, financial, investment, trading, or other types of advice or recommendations supplied or endorsed by TradingView. Read more in the Terms of Use.