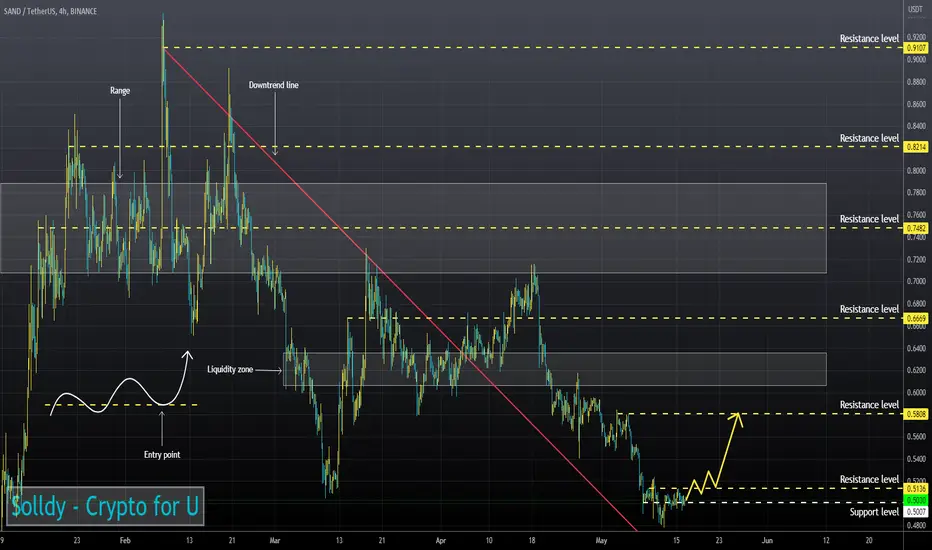
RSI indicates that a bullish divergence is forming on the 4H Timeframe.
The RSI chart is near neutral values (4H, 1H and 30m TFs)
50EMA has broken up 200EMA on the 1H Timeframe.
I believe the asset will continue to rise after fixing above the resistance level.
The RSI chart is near neutral values (4H, 1H and 30m TFs)
50EMA has broken up 200EMA on the 1H Timeframe.
I believe the asset will continue to rise after fixing above the resistance level.
Disclaimer
The information and publications are not meant to be, and do not constitute, financial, investment, trading, or other types of advice or recommendations supplied or endorsed by TradingView. Read more in the Terms of Use.
Disclaimer
The information and publications are not meant to be, and do not constitute, financial, investment, trading, or other types of advice or recommendations supplied or endorsed by TradingView. Read more in the Terms of Use.