📈 SAP SE – Gann Projection Signals Major Downside Risk
📅 July 30, 2025 | TF: Daily | Ticker: SAP.XETR
🧠 Concept
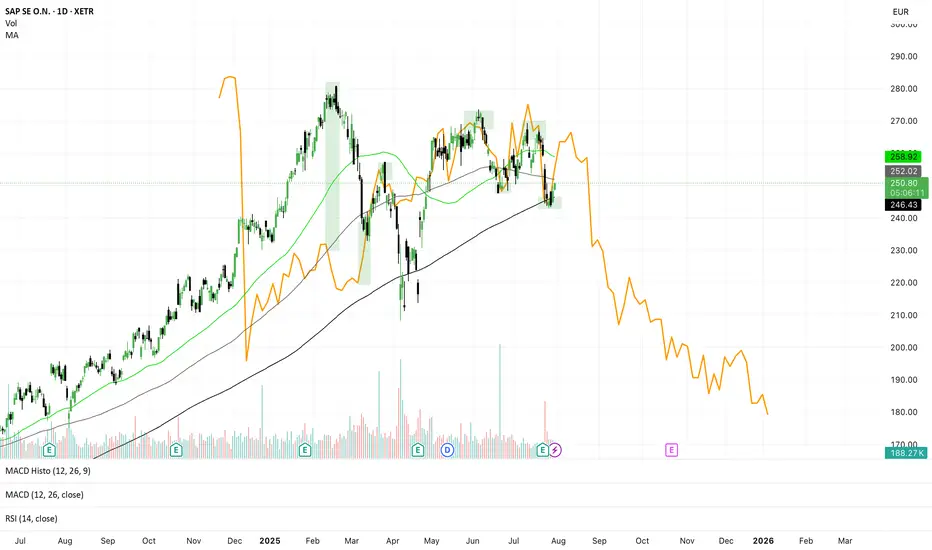
Using a historical correction (orange line) from SAP’s past — projected into the future using Gann symmetry — we might be witnessing a repeating time-price pattern. This method suggests the current market is rhyme-repeating a prior bearish phase.
🔍 Technical Highlights
🟢 Current Price: €250.60
📉 Bearish Projection (orange): suggests steep decline into Q4 2025, possibly toward €180
📊 Price reacting near MA200 (~€258) and MA50 (~€246) → tight squeeze zone
📉 MACD bearish, RSI neutral/slightly weak (~44)
📐 Gann Interpretation
The orange fractal projects an accelerated downtrend starting from this level — mirroring the structure of a previous correction in SAP.
Gann symmetry often aligns time and price harmonics, and right now:
📅 Time match: We're at a comparable point in the cycle
💶 Price zone match: Similar resistance/consolidation structure
🧭 Trade Setup
🟥 Short Bias if Breakdown Confirmed
Entry: Below €246
Targets:
▸ €225
▸ €210
▸ €185 (end of fractal projection)
Stop: above €258 (or trendline resistance)
🟩 Invalidation / Bullish Breakout
Close above €258 with strong volume
Watch for Gann failure → possible breakout to €268–€280
🧊 Risk Note
This is a fractal-based idea — not guaranteed, but supported by price structure and momentum. Confirmation from volume, RSI breakdowns, or macro catalysts is key.
📅 July 30, 2025 | TF: Daily | Ticker: SAP.XETR
🧠 Concept
Using a historical correction (orange line) from SAP’s past — projected into the future using Gann symmetry — we might be witnessing a repeating time-price pattern. This method suggests the current market is rhyme-repeating a prior bearish phase.
🔍 Technical Highlights
🟢 Current Price: €250.60
📉 Bearish Projection (orange): suggests steep decline into Q4 2025, possibly toward €180
📊 Price reacting near MA200 (~€258) and MA50 (~€246) → tight squeeze zone
📉 MACD bearish, RSI neutral/slightly weak (~44)
📐 Gann Interpretation
The orange fractal projects an accelerated downtrend starting from this level — mirroring the structure of a previous correction in SAP.
Gann symmetry often aligns time and price harmonics, and right now:
📅 Time match: We're at a comparable point in the cycle
💶 Price zone match: Similar resistance/consolidation structure
🧭 Trade Setup
🟥 Short Bias if Breakdown Confirmed
Entry: Below €246
Targets:
▸ €225
▸ €210
▸ €185 (end of fractal projection)
Stop: above €258 (or trendline resistance)
🟩 Invalidation / Bullish Breakout
Close above €258 with strong volume
Watch for Gann failure → possible breakout to €268–€280
🧊 Risk Note
This is a fractal-based idea — not guaranteed, but supported by price structure and momentum. Confirmation from volume, RSI breakdowns, or macro catalysts is key.
Disclaimer
The information and publications are not meant to be, and do not constitute, financial, investment, trading, or other types of advice or recommendations supplied or endorsed by TradingView. Read more in the Terms of Use.
Disclaimer
The information and publications are not meant to be, and do not constitute, financial, investment, trading, or other types of advice or recommendations supplied or endorsed by TradingView. Read more in the Terms of Use.