Long
Sugar : Bullish Price Action In Full Progress

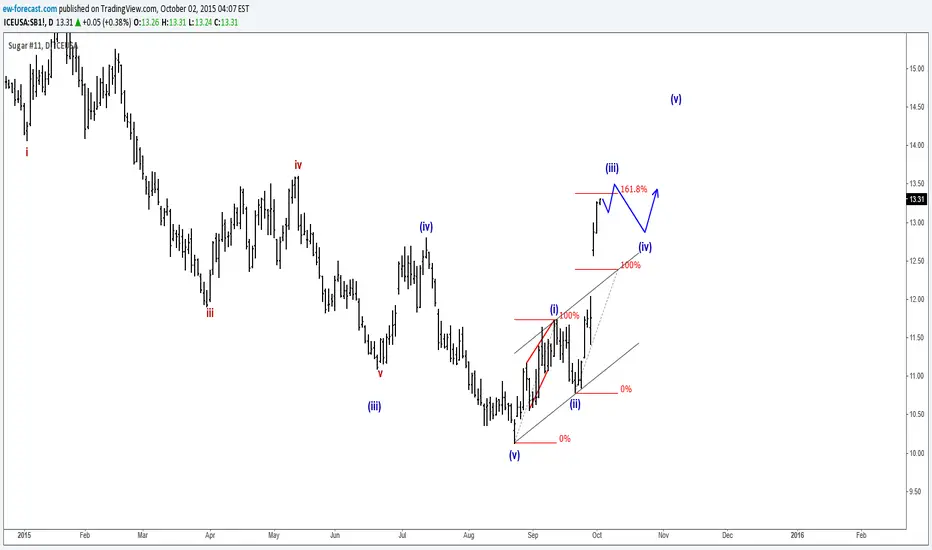
On the Daily chart of Sugar, price is trading in a three wave action. We are more and more viewing this three wave action as a new bullish cycle, because of a broken upper channel line and a very sharp action in current wave (iii) . That said price could be facing a correction in blue wave (iv) in days ahead before market will continue even higher within impulse.
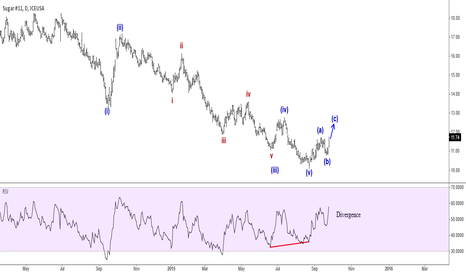
Links to our previous updates on this Commodity :

Links to our previous updates on this Commodity :

US Single STOCKS (FREE Access), FX, Crypto
👉Explore Our Services @ wavetraders.com/elliott-wave-plans/
Learn Elliott Waves
👉 wavetraders.com/academy/
Newsletter Sign up
👉 bit.ly/3FVPVzO
👉Explore Our Services @ wavetraders.com/elliott-wave-plans/
Learn Elliott Waves
👉 wavetraders.com/academy/
Newsletter Sign up
👉 bit.ly/3FVPVzO
Disclaimer
The information and publications are not meant to be, and do not constitute, financial, investment, trading, or other types of advice or recommendations supplied or endorsed by TradingView. Read more in the Terms of Use.