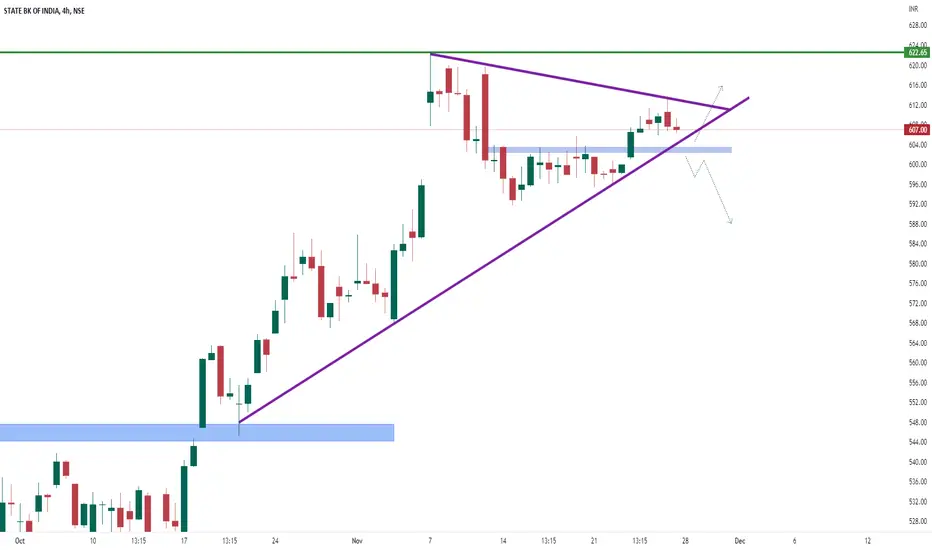
hey traders this 1 hourly timeframe chart of state bank of India. It is making a good price action pattern in which 600 level is act as resistance zone
below this level this stock may got weak
Above 600 stock is still bullish for me
below this level this stock may got weak
Above 600 stock is still bullish for me
Disclaimer
The information and publications are not meant to be, and do not constitute, financial, investment, trading, or other types of advice or recommendations supplied or endorsed by TradingView. Read more in the Terms of Use.
Disclaimer
The information and publications are not meant to be, and do not constitute, financial, investment, trading, or other types of advice or recommendations supplied or endorsed by TradingView. Read more in the Terms of Use.