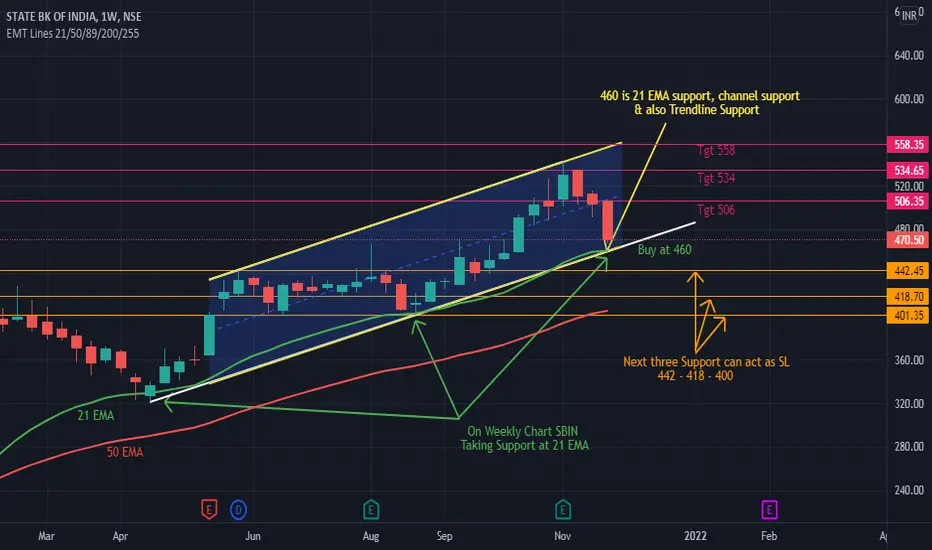
On Weekly Chart SBIN is following within Channel
460 level is a good Channel Support, Trendline Support & also 21 EMA support on weekly Chart.
taking Support at 89 EMA on Daily Chart.
SBIN Buy near 460
Tgt 506-534-558
small Sl 442
Deep SL 400 (Also near 50 EMA on weekly Chart)
Please Correlate by yourself also on charts. This is for Educational and Paper Trading Purpose Only. Must Consult your financial advisor before Investing.
Disclaimer
The information and publications are not meant to be, and do not constitute, financial, investment, trading, or other types of advice or recommendations supplied or endorsed by TradingView. Read more in the Terms of Use.
Disclaimer
The information and publications are not meant to be, and do not constitute, financial, investment, trading, or other types of advice or recommendations supplied or endorsed by TradingView. Read more in the Terms of Use.