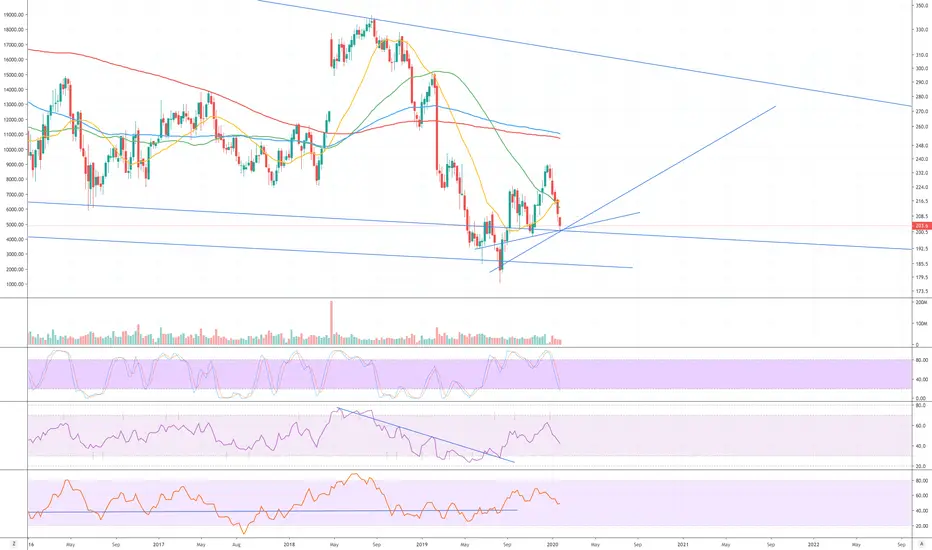
Stock should be trading around £300 / + 150% in 18 months. Not a bad trade for investors looking to play it safe in the face of an 'alleged recession' being in the post. The stock has been trading inside this descending triangle for years and just confirmed support on the bottom.
The monthly chart below confirms the bullish divergence.

The monthly chart below confirms the bullish divergence.
Trade active
Bullish divergence continues to grow with MFI support suggested until 2023Note
Almost at target / up 40% in 17 months, not bad.Price action on the 3-month chart is now at resistance - will it break through this time? I don't know. It will eventually.
Trade closed: target reached
BTC
bc1q2eckdzh0q8vsd7swcc8et6ze7s99khhxyl7zwy
Weblink: patreon.com/withoutworries
Allow 3-6 months on ideas. Not investment advice. DYOR
bc1q2eckdzh0q8vsd7swcc8et6ze7s99khhxyl7zwy
Weblink: patreon.com/withoutworries
Allow 3-6 months on ideas. Not investment advice. DYOR
Disclaimer
The information and publications are not meant to be, and do not constitute, financial, investment, trading, or other types of advice or recommendations supplied or endorsed by TradingView. Read more in the Terms of Use.