SBS (Energy Company) – Pullback Buy Setup
🎯 Trade: Long (Buy)
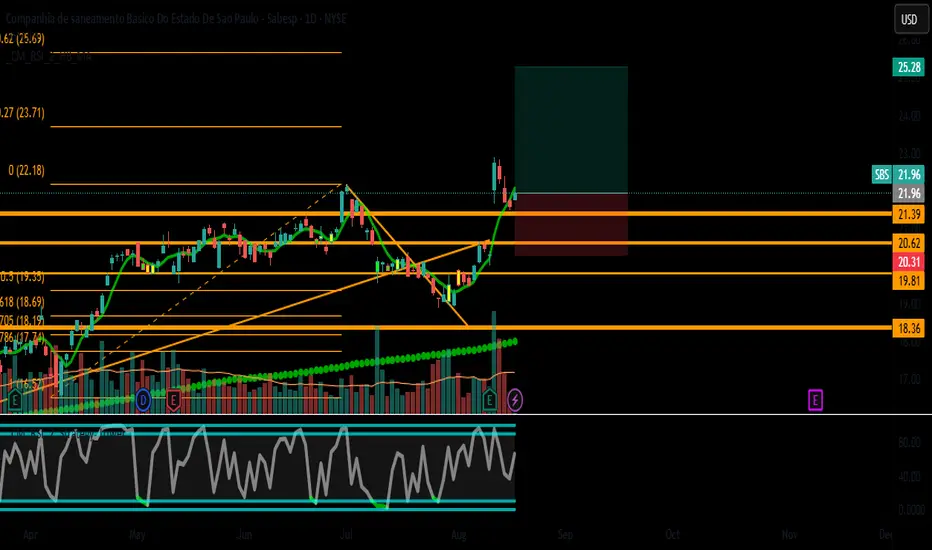
📊 Timeframe: Daily (D1)
💰 Entry: $21.96 (dynamic support zone)
🛑 Stop Loss: $20.30 (below SMA 50 & recent swing low)
🎯 Take Profit 1: $23.50 (previous resistance)
🎯 Take Profit 2: $25.30 (all-time high + Fibonacci extension)
🔍 Technical Analysis
✅ Uptrend Confirmed:
Price above SMA 20 (20.31) and SMA 50 (20.55), confirming bullish structure.
MACD positive & RSI at 62.5 (healthy momentum, no overbought signal).
✅ Optimal Entry Zone:
Pullback to $21.96, aligning with SMA 20 support and prior liquidity zone.
✅ Risk Management:
SL at $20.30 (-7.5% from entry), protecting against a breakdown.
Risk:Reward = 1:3 (TP1 = +7%, TP2 = +15%).
📈 Strong Fundamentals (Score 9/10)
✔ Revenue Growth: +$957M YoY.
✔ Debt-Free: Robust balance sheet.
✔ Undervalued: P/S Ratio of 0.37 (sector avg. ~1.2).
🎯 Scenarios
✅ Bullish Case: Break above $23.50 targets $25.30 (TP2).
⚠️ Sideways Case: If price consolidates in $21.50-$23, consider moving TP1 to breakeven.
❌ Bearish Case: Weekly close below $20.30 invalidates the setup.
📢 Conclusion
SBS presents a high-probability long opportunity with an attractive RR, supported by:
1️⃣ Clear technical support (SMA 20 + pullback).
2️⃣ Exceptional fundamentals (growth + undervaluation).
3️⃣ Momentum signals (MACD uptick + neutral RSI).
🔔 What do you think? More upside ahead, or wait for a deeper pullback?
#Trading #Stocks #SBS #Energy #TechnicalAnalysis #FundamentalAnalysis
(Disclaimer: Not financial advice. Conduct your own analysis before trading.)
Disclaimer
The information and publications are not meant to be, and do not constitute, financial, investment, trading, or other types of advice or recommendations supplied or endorsed by TradingView. Read more in the Terms of Use.
Disclaimer
The information and publications are not meant to be, and do not constitute, financial, investment, trading, or other types of advice or recommendations supplied or endorsed by TradingView. Read more in the Terms of Use.