Most traders miss the forest for the trees. They spend their entire day glued to intraday charts, scalping for a few cents, and they completely ignore the bigger picture. But here’s the truth: the biggest moves, the cleanest swing trades, come from the higher timeframes — monthly and weekly charts. Today, I will break down why that matters, and we’ll use Starbucks stock, ticker SBUX, as a perfect example.
The Importance of Bigger Timeframes
When you zoom out to the monthly timeframe, you’re looking at where the real money plays — hedge funds, institutions, the smart money. These guys aren’t trading 5-minute charts. They’re building positions in massive supply and demand imbalances.
If you ignore those levels, you’re basically trading blind. It’s like trying to surf without paying attention to the tide. You might catch a wave or two, but eventually, the tide will wipe you out.”
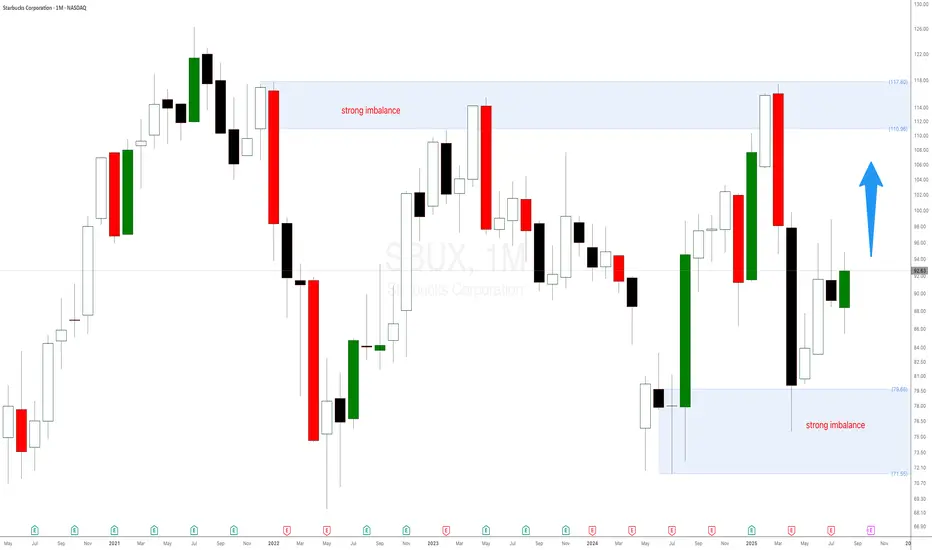
Starbucks Monthly Demand at $79.68
Let’s look at Starbucks. Right now, we’ve got a strong monthly demand imbalance of around $79.68. Price dropped into that zone, and what happens next? Buyers step in, and bullish candlesticks start forming.
This isn’t magic. This is pure supply and demand. At that price, Starbucks became too cheap for the big players to ignore. They’re scooping it up, and as a result, smaller timeframes start printing bullish price action. The monthly demand fuels the fire.
There is room to reach the tested monthly supply at $110.
The Importance of Bigger Timeframes
When you zoom out to the monthly timeframe, you’re looking at where the real money plays — hedge funds, institutions, the smart money. These guys aren’t trading 5-minute charts. They’re building positions in massive supply and demand imbalances.
If you ignore those levels, you’re basically trading blind. It’s like trying to surf without paying attention to the tide. You might catch a wave or two, but eventually, the tide will wipe you out.”
Starbucks Monthly Demand at $79.68
Let’s look at Starbucks. Right now, we’ve got a strong monthly demand imbalance of around $79.68. Price dropped into that zone, and what happens next? Buyers step in, and bullish candlesticks start forming.
This isn’t magic. This is pure supply and demand. At that price, Starbucks became too cheap for the big players to ignore. They’re scooping it up, and as a result, smaller timeframes start printing bullish price action. The monthly demand fuels the fire.
There is room to reach the tested monthly supply at $110.
Alfonso Moreno
Set and Forget Trading Community
Set and Forget Trading Community
Disclaimer
The information and publications are not meant to be, and do not constitute, financial, investment, trading, or other types of advice or recommendations supplied or endorsed by TradingView. Read more in the Terms of Use.