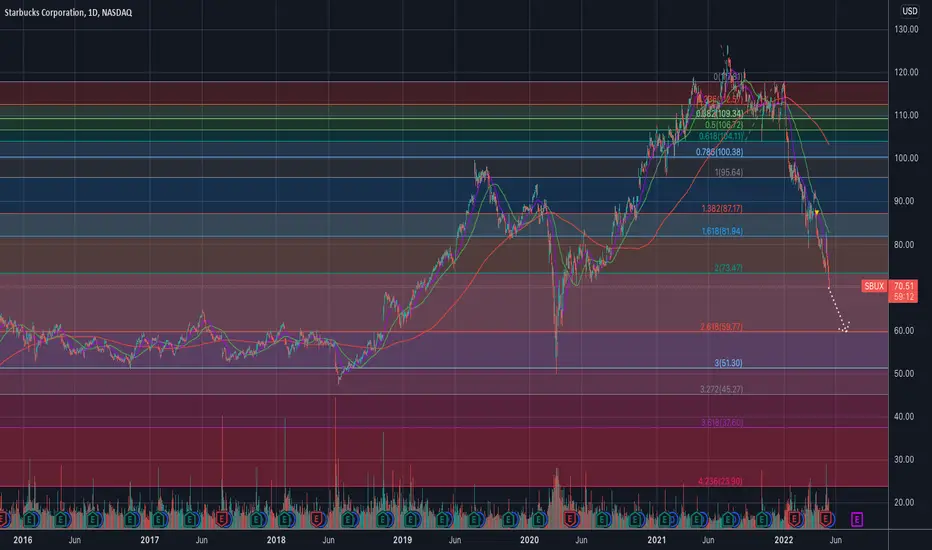
Previously I mentioned that I might be interested in taking a position around $73 but I didn't because it doesn't look like its done falling.
I believe it is going to $60 area before finding some sort of support.
What do you think?
Disclaimer: Not investment advice.
———————————————————
How to read my charts?
- Matching color trend lines shows the pattern. Sometimes a chart can have multiple patterns. Each pattern will have matching color trend lines.
- The yellow horizontal lines show support and resistance areas.
- Fib lines also show support and resistance areas.
- The dotted white lines show the price projection for breakout or breakdown target.
Disclaimer: Not investment advice.
I am not a licensed professional. None of the posts that I published are investment advice. Do your own research.
Related publications
Disclaimer
The information and publications are not meant to be, and do not constitute, financial, investment, trading, or other types of advice or recommendations supplied or endorsed by TradingView. Read more in the Terms of Use.