Straight to the point, buy Starbucks if the price breaks through the red resistance line with RSI also rising above 45.
Here is why.
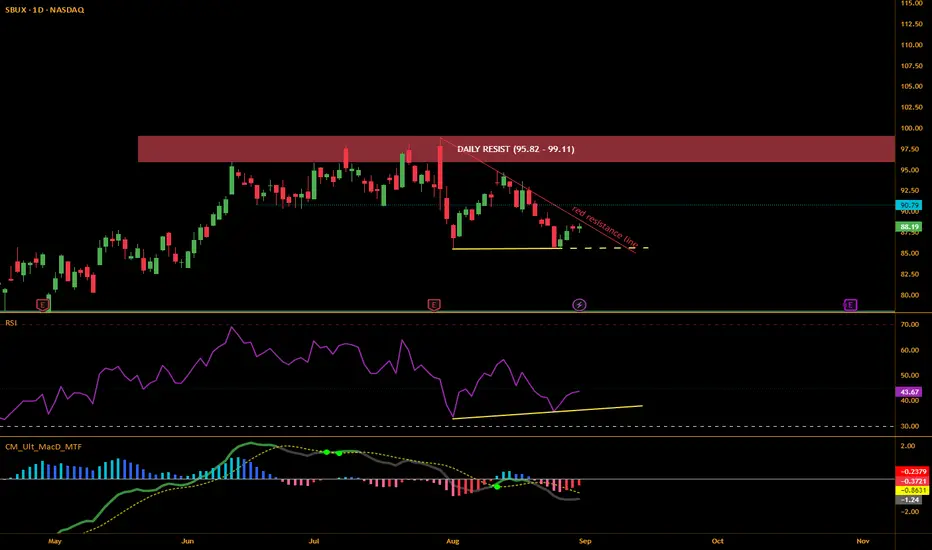
The price of Starbucks is currently within the flat bottom wedge.
It is showing a temporary rebound after reaching the previous low pivot point of August 1st (85.49).
But the RSI is making a higher low, indicating a weaker selling pressure.
I've been talking a lot about RSI Divergence recently. RSI Divergence is when price and RSI moves in an opposite direction - e.g. Price making lower lows while RSI making higher lows, meaning although price is lower, selling pressure has weakened.
In this case, Starbucks did not make a lower low in price, but showed a persisting support from the previous low price while RSI making a higher low. This isn't a classic divergence, but is still a good sign for an uptrend.
However, we can't be sure yet because there is a resistance line right above the price.
If the price manages to break through this line, we may be more confident in a bullish trend.
Another concern is that RSI is below 45,which is relatively weak in strength.
RSI needing to be above 45 isn't anywhere in the textbook, but it's just my personal opinion from my experiences that RSI needs to be at least 45 to confirm a bullish movement.
But relying just on RSI can be too hopeful and that is why I brought several more indicators to further support my idea.

Look at this chart with two RSI Divergence indicators. They are created by Shizaru and compare two RSIs (fast and slow).
The upper one compares RSI 9 and 21. The lower one, 5 and 14, classic.
Not only we see a higher low in RSI, but we also see a higher low both in RSI Divergence (9,21) and RSI Divergence (5,14).
This really tells that the selling pressure has weakened.
But if you are still skeptical and want to be extra careful (which I highly respect), wait for the MACD Signal.

In the original chart, you will see an MACD Indicator at the bottom (credit goes to ChrisMoody).
A large green dot indicates a bullish signal.
So if price breaks through the wedge, RSI climbs above 45 and MACD signals for bull, buy Starbucks.
* Like my other posts, this isn't a long term strategy.
We aim for a few percentage profit within days or weeks.
* Managing your exit strategy is the most crucial part in trading. You don't want your heart to grow bitter which will lead you to greed and eventually, failure.
One of the way I would recommend is to split your exit. Don't just dump the whole thing in a single exit. Instead, sell 70%. Keep the rest and see what happens.
If the price starts to fall, sell: it's less but still a profit.
If the price jumps (which happens quite often), sell: now you don't have to feel bitter for missing out.
Or use 60-30-10 strategy.
Sell 60% at the first selling point(resistance level), 30% at the second(major resistance zone), and keep the 10% in case the price breaks through the resistance.
This way you lock in your profit but also gain advantage from a surprise breakthrough.
Here is why.
The price of Starbucks is currently within the flat bottom wedge.
It is showing a temporary rebound after reaching the previous low pivot point of August 1st (85.49).
But the RSI is making a higher low, indicating a weaker selling pressure.
I've been talking a lot about RSI Divergence recently. RSI Divergence is when price and RSI moves in an opposite direction - e.g. Price making lower lows while RSI making higher lows, meaning although price is lower, selling pressure has weakened.
In this case, Starbucks did not make a lower low in price, but showed a persisting support from the previous low price while RSI making a higher low. This isn't a classic divergence, but is still a good sign for an uptrend.
However, we can't be sure yet because there is a resistance line right above the price.
If the price manages to break through this line, we may be more confident in a bullish trend.
Another concern is that RSI is below 45,which is relatively weak in strength.
RSI needing to be above 45 isn't anywhere in the textbook, but it's just my personal opinion from my experiences that RSI needs to be at least 45 to confirm a bullish movement.
But relying just on RSI can be too hopeful and that is why I brought several more indicators to further support my idea.
Look at this chart with two RSI Divergence indicators. They are created by Shizaru and compare two RSIs (fast and slow).
The upper one compares RSI 9 and 21. The lower one, 5 and 14, classic.
Not only we see a higher low in RSI, but we also see a higher low both in RSI Divergence (9,21) and RSI Divergence (5,14).
This really tells that the selling pressure has weakened.
But if you are still skeptical and want to be extra careful (which I highly respect), wait for the MACD Signal.
In the original chart, you will see an MACD Indicator at the bottom (credit goes to ChrisMoody).
A large green dot indicates a bullish signal.
So if price breaks through the wedge, RSI climbs above 45 and MACD signals for bull, buy Starbucks.
* Like my other posts, this isn't a long term strategy.
We aim for a few percentage profit within days or weeks.
* Managing your exit strategy is the most crucial part in trading. You don't want your heart to grow bitter which will lead you to greed and eventually, failure.
One of the way I would recommend is to split your exit. Don't just dump the whole thing in a single exit. Instead, sell 70%. Keep the rest and see what happens.
If the price starts to fall, sell: it's less but still a profit.
If the price jumps (which happens quite often), sell: now you don't have to feel bitter for missing out.
Or use 60-30-10 strategy.
Sell 60% at the first selling point(resistance level), 30% at the second(major resistance zone), and keep the 10% in case the price breaks through the resistance.
This way you lock in your profit but also gain advantage from a surprise breakthrough.
God bless you :)
Disclaimer
The information and publications are not meant to be, and do not constitute, financial, investment, trading, or other types of advice or recommendations supplied or endorsed by TradingView. Read more in the Terms of Use.
God bless you :)
Disclaimer
The information and publications are not meant to be, and do not constitute, financial, investment, trading, or other types of advice or recommendations supplied or endorsed by TradingView. Read more in the Terms of Use.