Before we dive into today's analysis, I'd like to thank you all for your continued support in helping me reach 5,000+ followers, I'm extremely grateful!
The setup displayed in front of you today is a prime example of market cycles repeating themselves, I have clearly illustrated on the chart the similarities between the two extended moves up.
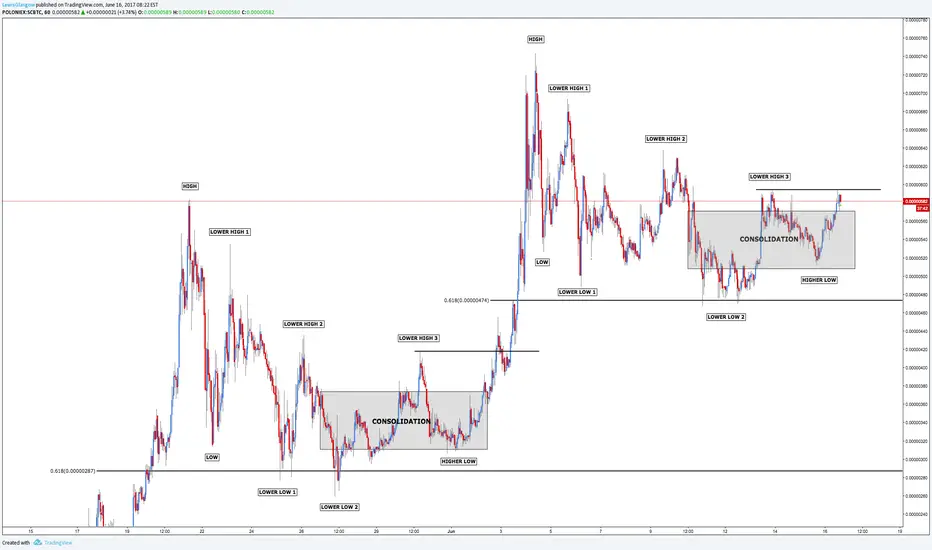
I'll strip this chart down from top to bottom.
Firstly, you can see both moves up fell back to the 0.618 retracement level before finding a solid support.

Both carrying similarities in terms of time and price, you can see move 1 lasted 5 days and 20 hours counting up to 140 price bars.
Move 2, on the other hand, lasted 6 days and 17 hours counting up to 161 price bars.
Taking a look at the chart shown below we experienced a very similar move in terms of price structure as well.

Both start off from high to low, of course, followed by a further 3 lower highs and 2 lower lows.
From there we saw a lot of consolidation before price direction suddenly changed as both created a higher low at a solid level of support.

Following the higher low, both re-tested the previous high (lower high 3).
In the first situation, this is what sparked the move up to 740.
Will we see a similar breakout to reach 900? Only time will tell.
The setup displayed in front of you today is a prime example of market cycles repeating themselves, I have clearly illustrated on the chart the similarities between the two extended moves up.
I'll strip this chart down from top to bottom.
Firstly, you can see both moves up fell back to the 0.618 retracement level before finding a solid support.
Both carrying similarities in terms of time and price, you can see move 1 lasted 5 days and 20 hours counting up to 140 price bars.
Move 2, on the other hand, lasted 6 days and 17 hours counting up to 161 price bars.
Taking a look at the chart shown below we experienced a very similar move in terms of price structure as well.
Both start off from high to low, of course, followed by a further 3 lower highs and 2 lower lows.
From there we saw a lot of consolidation before price direction suddenly changed as both created a higher low at a solid level of support.
Following the higher low, both re-tested the previous high (lower high 3).
In the first situation, this is what sparked the move up to 740.
Will we see a similar breakout to reach 900? Only time will tell.
Note
Well, that was quicker than expected.Note
It seems price is repeating the exact same pattern as before, it broke the previous high followed by a sharp decline.Once price finds support we should see an extended move up.
Note
Price found support at 580 followed by a move up to break the high at 640, we're now on track for a move to 690.Note
We're quickly approaching 690, expecting a drop before the next move up to 740.Note
Pay attention to these levels going forward, we may see one more drop between 690 and 700 followed by a breakout to create a new high.Depending on volume we may break 700 and continue to hit 740, key timeframes to watch right now are the 15m, 30m and 1h.
Note
We're now at 640 support, I noticed a minor support trendline holding on the 15m chart, we shall see what happens from here.Note
The trendline on the 15m chart held really well, price failed to close below.Keep an eye on this going forward... If this holds we are in for a big move up!
Note
We have now arrived at 740, once we break the high we will see Sia take off!Note
Following the drop from 840, price is now starting to show signs of upside movement.The trendline is holding well, looking for Siacoin to stay and trade above 740 over the weekend.
Note
The market seems to have bottomed after the panic we seen over the last two weeks.Siacoin has formed a valid bullish shark and bullish deep crab on the 4h chart, which indicates a move to 615.
📈 Master the Art and Science of Trading: sixfigurecapital.com
Related publications
Disclaimer
The information and publications are not meant to be, and do not constitute, financial, investment, trading, or other types of advice or recommendations supplied or endorsed by TradingView. Read more in the Terms of Use.