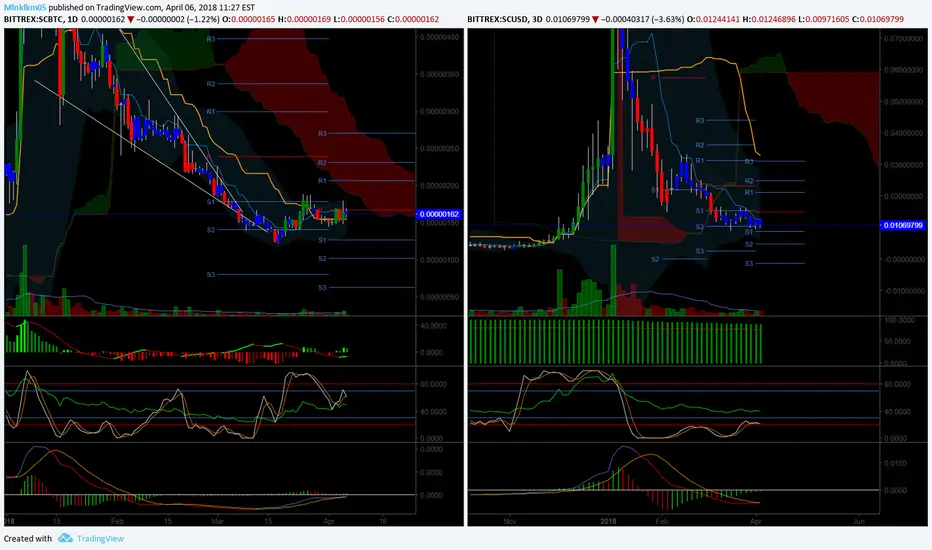
after such a long time daily is bullish as u see left side, try to hodl
and see how tenkan crossover kijun and price above both of it
also daily dm+ above dm- a good sign too
right side 3d chart
blue lines are support and resistance lines if needed s1,s2 support and r1,r2 resistance fibonacci levels
and see how tenkan crossover kijun and price above both of it
also daily dm+ above dm- a good sign too
right side 3d chart
blue lines are support and resistance lines if needed s1,s2 support and r1,r2 resistance fibonacci levels
Disclaimer
The information and publications are not meant to be, and do not constitute, financial, investment, trading, or other types of advice or recommendations supplied or endorsed by TradingView. Read more in the Terms of Use.
Disclaimer
The information and publications are not meant to be, and do not constitute, financial, investment, trading, or other types of advice or recommendations supplied or endorsed by TradingView. Read more in the Terms of Use.