The following content is machine translation:
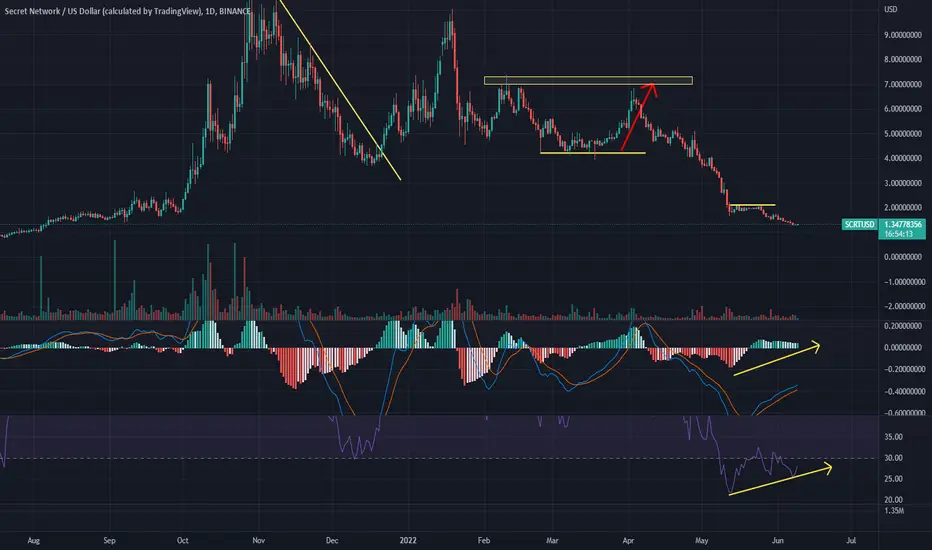
On the daily chart, it continues to fall this year. It closed positive yesterday, ending this year's decline. It continues to rise today and is expected to rebound.
The market has continued to fall recently. The speed and slow lines of the indicator macd are scattered below the zero axis, and the energy column is running above the zero axis, which is seriously deviating from the k-line. The RSI indicator deviates from the bottom of the oversold zone and begins to shift to more today, and is expected to rebound continuously.
In terms of operation, there is a serious deviation from the bottom. At present, there is a change to more, and more, and the stop loss falls below the low point of yesterday.
📈📉 Join our analysis channel,加入我们的频道:👇
t.me/CryptoObservation
📈📉 我们的中文电报社区:👇
t.me/CryptoMiningCN
☯️ 我们目前提供更高准确度的交易指引,请加入我们的电报社区后和管理员联系。☯️
t.me/CryptoObservation
📈📉 我们的中文电报社区:👇
t.me/CryptoMiningCN
☯️ 我们目前提供更高准确度的交易指引,请加入我们的电报社区后和管理员联系。☯️
Disclaimer
The information and publications are not meant to be, and do not constitute, financial, investment, trading, or other types of advice or recommendations supplied or endorsed by TradingView. Read more in the Terms of Use.