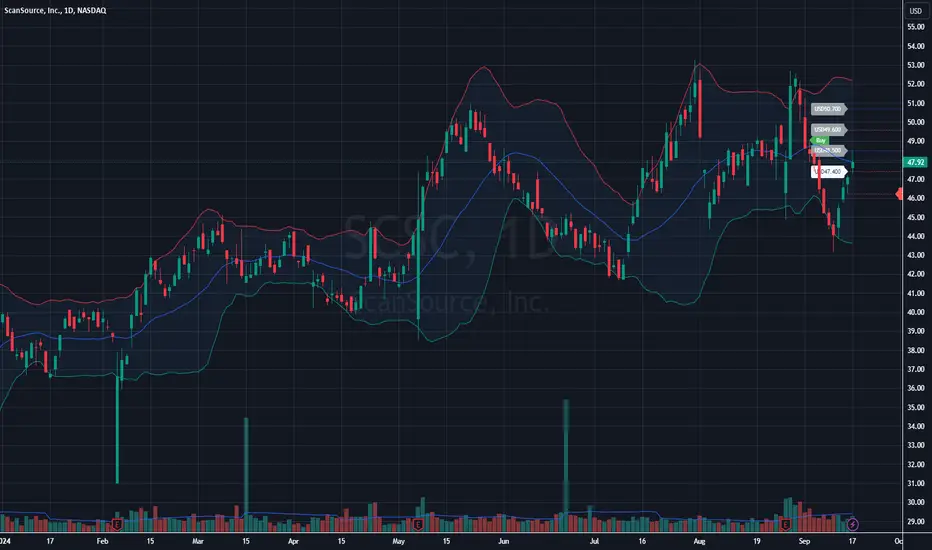
- The price has recently bounced from the lower Bollinger Band and is heading towards the middle band (likely the 20-period simple moving average).
- When price bounces from the lower band, it can signal a potential recovery or a short-term rally.
- There is a noticeable gap up followed by consolidation near the upper band in the past.
- The stock has recently been in a correction phase, pulling back from highs near $53 down to around $45, where it's now bouncing.
- Based on the Bollinger Bands' behavior, the chart could be showing signs of consolidation after a downtrend.
- If price moves above the middle Bollinger Band and sustains it, it could suggest a potential continuation of an uptrend.
- Bullish Case: If the price breaks and holds above the middle band (around $48), it could attempt to test the upper band (~$52).
- Bearish Case: Failure to break and sustain above the middle band may lead the price to retest the lower Bollinger Band (~$44), especially if broader market conditions remain weak.
➀➁➂➃➄
Disclaimer
The information and publications are not meant to be, and do not constitute, financial, investment, trading, or other types of advice or recommendations supplied or endorsed by TradingView. Read more in the Terms of Use.
➀➁➂➃➄
Disclaimer
The information and publications are not meant to be, and do not constitute, financial, investment, trading, or other types of advice or recommendations supplied or endorsed by TradingView. Read more in the Terms of Use.