Trend Analysis :
Bollinger Bands :
Volume Analysis :
Support and Resistance Levels :
Candlestick Patterns :
Overall Sentiment :
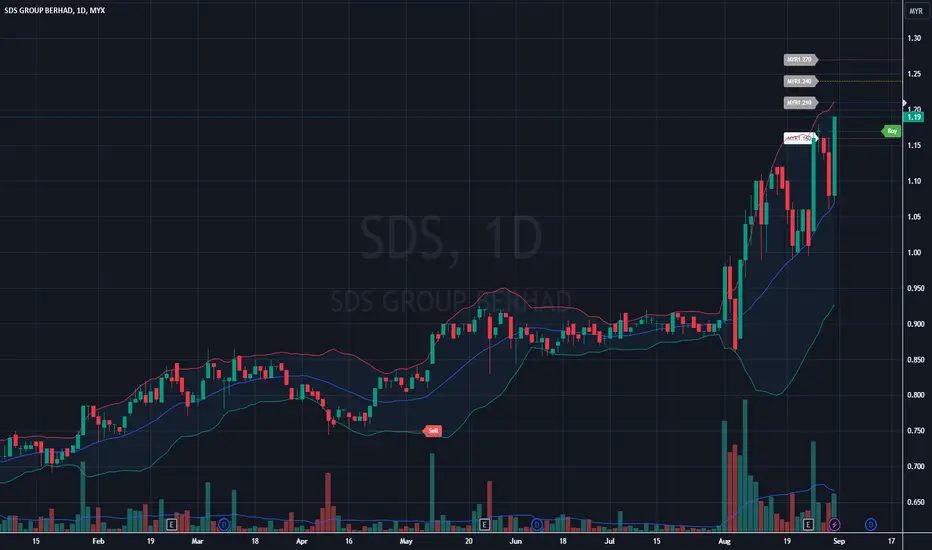
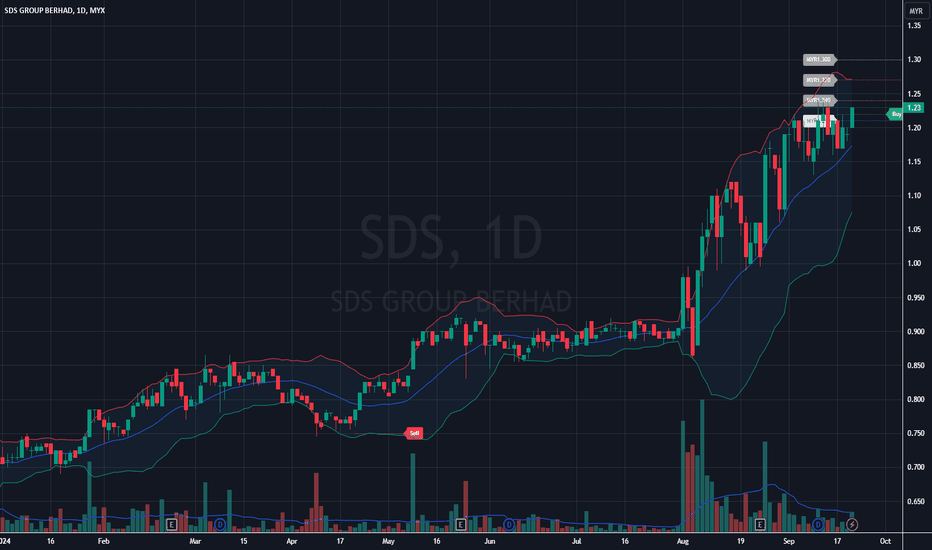
- Short-Term Trend: The stock has been in an uptrend since early August, with a notable increase in both price and volume, indicating strong bullish momentum. The recent candles show higher highs and higher lows, typical of an uptrend.
- Medium-Term Trend: The medium-term trend has been sideways from May to July, with prices consolidating between MYR0.85 and MYR1.05. The recent breakout above MYR1.05 signals a potential continuation of the uptrend.
Bollinger Bands :
- The Bollinger Bands are expanding, which often indicates increased volatility. The price recently touched the upper band, which is generally seen as a sign of overbought conditions in the short term. However, the strong bullish candles suggest that the uptrend might continue, especially if the price stays above the middle band (20-day moving average).
Volume Analysis :
- The volume spikes seen during the recent uptrend confirm the strength of the breakout. Increased volume on up days is a positive sign and suggests that the recent price move is supported by strong buying interest.
Support and Resistance Levels :
- Immediate Support: Around MYR1.05, which was the previous resistance level before the breakout. If the price pulls back, this level could act as a support.
- Immediate Resistance: Around MYR1.20, which is where the stock is currently trading. If the price continues to rise, this level could be tested as the next resistance.
Candlestick Patterns :
- The recent candlestick pattern is a strong bullish candle, which suggests that buyers are in control. However, watching for any reversal patterns at the resistance level is essential.
Overall Sentiment :
- The overall sentiment for SDS appears to be bullish in the short term, with strong price action, volume, and moving averages supporting the uptrend. However, traders should monitor the price action closely near resistance levels and be cautious of any signs of reversal or consolidation.
Note
➀➁➂➃➄
Disclaimer
The information and publications are not meant to be, and do not constitute, financial, investment, trading, or other types of advice or recommendations supplied or endorsed by TradingView. Read more in the Terms of Use.
➀➁➂➃➄
Disclaimer
The information and publications are not meant to be, and do not constitute, financial, investment, trading, or other types of advice or recommendations supplied or endorsed by TradingView. Read more in the Terms of Use.