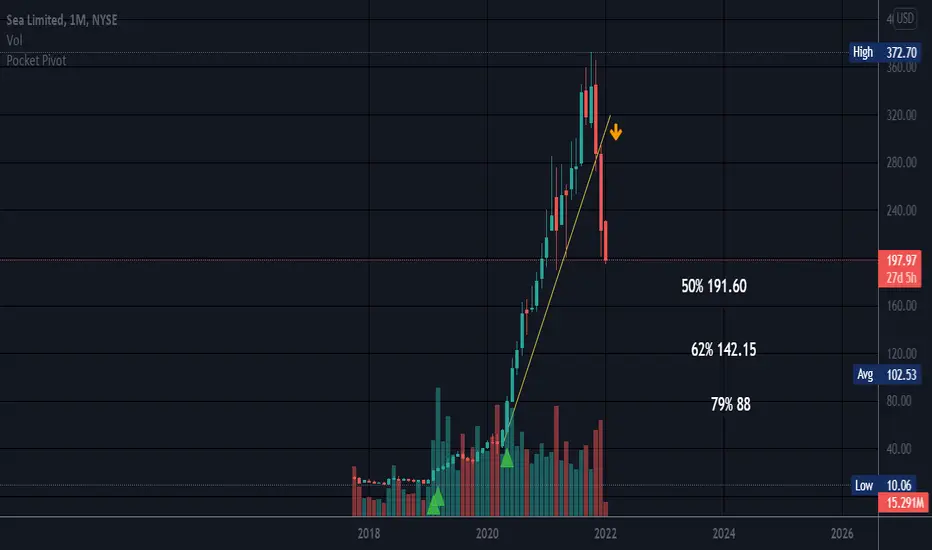
Looks steep on monthly. This is a monthly chart.
Most Arcs take a breather at the 50% mark. The average arc falls between 62 to 79% of the rise up in correction mode.
A parabolic arc can be volatile on the way down and there will most likely be rallies up on the way down. An arc can far more or less than these levels.
Short interest is 5.6% which to me is not super high.
No recommendation.
Parabolic Arcs are caused by extreme bullishness causing an unsustainable rise to the upside.
Daily chart below. Price is below the bottom band which may cause a snap back to the interior of the bands. Gapped down today. Be safe on this one for now.
Note
Correction: A Parabolic arc can fall more or less than these levels with the average fall in correction mode being between the .618 and .786 fib levels measured from the beginning of the rise up to the high. Sometimes an ARC will continue to climb for a while after the ARC has formed which can look like an inverted C. Sometimes they look like a straight line up on the monthly or weekly time frame.Disclaimer
The information and publications are not meant to be, and do not constitute, financial, investment, trading, or other types of advice or recommendations supplied or endorsed by TradingView. Read more in the Terms of Use.
Disclaimer
The information and publications are not meant to be, and do not constitute, financial, investment, trading, or other types of advice or recommendations supplied or endorsed by TradingView. Read more in the Terms of Use.