Hello, traders.
If you "follow", you can always get the latest information quickly.
Have a nice day today.
-------------------------------------
(SEIUSDT.P 1M chart)
I wonder what the 1M chart means on the futures chart, but if you know the current big picture trend, I think you can trade according to your main and secondary positions.
Currently, the volume profile section is formed at 0.2392 on the 1M chart, so it is expected that the major trend will be determined based on this point.
In other words, if the price is maintained above 0.2392, I think it is highly likely to turn into an uptrend.
-
(1W chart)
Currently, on the 1W chart, we are checking for support near the 0.2750 point, which is the StochRSI 80 indicator point.
The StochRSI 80 indicator is one of the indicators that indicates the high point section.
Therefore, if it is supported near the StochRSI 80 indicator, it is highly likely to rise.
On the other hand, if it is not supported, it is important to check for support because it corresponds to the resistance point.
Once the rise begins, it is basically likely to rise until it meets the HA-High indicator.
The HA-High indicator is currently formed at 0.7406.
However, when rising, there is a possibility of receiving resistance near the area where the arrow is pointing, so you should think about a countermeasure.
-
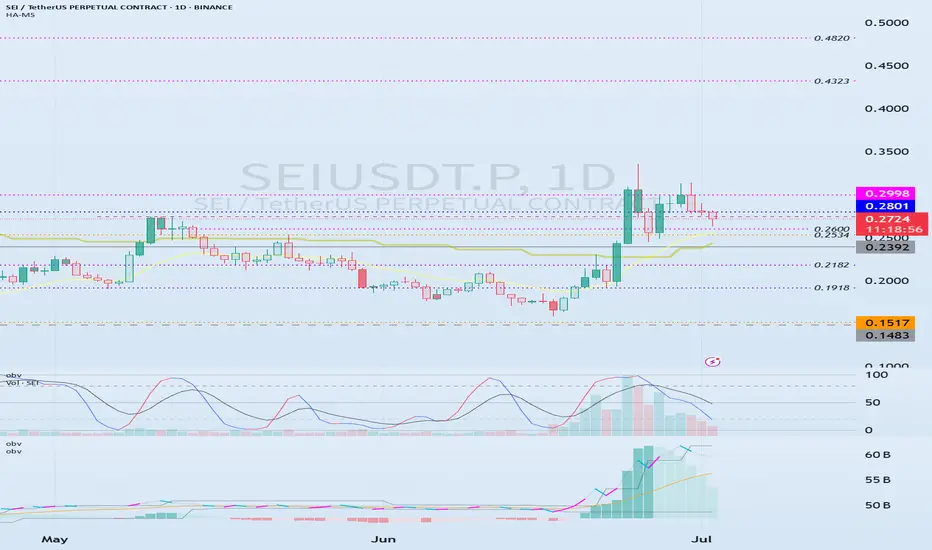
(1D chart)
In order to rise, the price must rise above the 0.2801-0.2998 range and maintain it.
If not, there is a possibility of falling until the HA-Low indicator is met.
However, since an important volume profile range is formed at the 0.2392 range, whether there is support near this area is an important issue.
Therefore, if it falls below 0.2392, it is recommended to stop trading and check the situation if possible.
If it rises above 0.2998, it seems likely to surge to the 0.4323-0.4820 range because the resistance range is weak.
-
Thank you for reading to the end.
I hope you have a successful trade.
--------------------------------------------------
- Here is an explanation of the big picture.
(3-year bull market, 1-year bear market pattern)

I will explain more details when the bear market starts.
------------------------------------------------------
Other content (coins, stocks, etc.) is frequently posted on X.
X에 다른 내용(코인, 주식 등)이 자주 게시.
◆ t.me/readCryptoChannel
[HA-MS Indicator]
bit.ly/3YxHgvN
[OBV Indicator]
bit.ly/4dcyny3
X에 다른 내용(코인, 주식 등)이 자주 게시.
◆ t.me/readCryptoChannel
[HA-MS Indicator]
bit.ly/3YxHgvN
[OBV Indicator]
bit.ly/4dcyny3
Related publications
Disclaimer
The information and publications are not meant to be, and do not constitute, financial, investment, trading, or other types of advice or recommendations supplied or endorsed by TradingView. Read more in the Terms of Use.