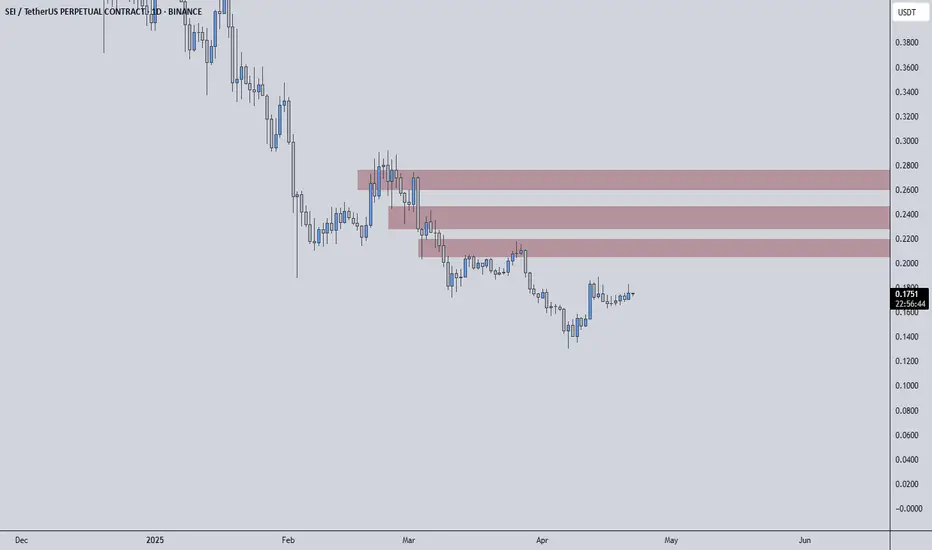
SEIUSDT continues to reflect weakness in its structure, and until proven otherwise, the red boxes remain key resistance zones. Buyers are still not stepping in with meaningful strength, and the overall market context doesn’t support a bullish shift yet.
🔴 Resistance Zones Are Still Dominant
The red boxes align with former support levels that now act as barriers. This type of flip often traps late buyers and offers great setups for short opportunities — but only with confirmation.
🔍 What to Watch For
Lower-Time-Frame Breakdown Patterns: Inside these red boxes, look for signs like bearish engulfing candles or lower highs on the 5-15 min charts.
CDV & Orderflow Weakness: If cumulative delta volume and tape show absorption or hidden selling, the likelihood of rejection increases.
Risk Management First: Use these zones not just for direction, but for well-defined invalidation points. If price pushes through and retests from above, then it's time to pivot your bias.
🚨 If Buyers Show Up…
I won’t stick to my short bias blindly. If SEIUSDT can break through the red resistance with strength, and more importantly hold above it, I will reassess and look for long setups — especially on the retest with bullish confirmations.
Markets can shift quickly, and we trade based on what the chart shows, not what we hope. For now, SEI remains under pressure. Be patient, act on signals, and never force a trade just because the price is near a key level.
📌I keep my charts clean and simple because I believe clarity leads to better decisions.
📌My approach is built on years of experience and a solid track record. I don’t claim to know it all but I’m confident in my ability to spot high-probability setups.
📌If you would like to learn how to use the heatmap, cumulative volume delta and volume footprint techniques that I use below to determine very accurate demand regions, you can send me a private message. I help anyone who wants it completely free of charge.
🔑I have a long list of my proven technique below:
I stopped adding to the list because it's kinda tiring to add 5-10 charts in every move but you can check my profile and see that it goes on..
🔴 Resistance Zones Are Still Dominant
The red boxes align with former support levels that now act as barriers. This type of flip often traps late buyers and offers great setups for short opportunities — but only with confirmation.
🔍 What to Watch For
Lower-Time-Frame Breakdown Patterns: Inside these red boxes, look for signs like bearish engulfing candles or lower highs on the 5-15 min charts.
CDV & Orderflow Weakness: If cumulative delta volume and tape show absorption or hidden selling, the likelihood of rejection increases.
Risk Management First: Use these zones not just for direction, but for well-defined invalidation points. If price pushes through and retests from above, then it's time to pivot your bias.
🚨 If Buyers Show Up…
I won’t stick to my short bias blindly. If SEIUSDT can break through the red resistance with strength, and more importantly hold above it, I will reassess and look for long setups — especially on the retest with bullish confirmations.
Markets can shift quickly, and we trade based on what the chart shows, not what we hope. For now, SEI remains under pressure. Be patient, act on signals, and never force a trade just because the price is near a key level.
📌I keep my charts clean and simple because I believe clarity leads to better decisions.
📌My approach is built on years of experience and a solid track record. I don’t claim to know it all but I’m confident in my ability to spot high-probability setups.
📌If you would like to learn how to use the heatmap, cumulative volume delta and volume footprint techniques that I use below to determine very accurate demand regions, you can send me a private message. I help anyone who wants it completely free of charge.
🔑I have a long list of my proven technique below:
- 🎯 ZENUSDT.P: Patience & Profitability | %230 Reaction from the Sniper Entry
- 🐶 DOGEUSDT.P: Next Move
- 🎨 RENDERUSDT.P: Opportunity of the Month
- 💎 ETHUSDT.P: Where to Retrace
- 🟢 BNBUSDT.P: Potential Surge
- 📊 BTC Dominance: Reaction Zone
- 🌊 WAVESUSDT.P: Demand Zone Potential
- 🟣 UNIUSDT.P: Long-Term Trade
- 🔵 XRPUSDT.P: Entry Zones
- 🔗 LINKUSDT.P: Follow The River
- 📈 BTCUSDT.P: Two Key Demand Zones
- 🟩 POLUSDT: Bullish Momentum
- 🌟 PENDLEUSDT.P: Where Opportunity Meets Precision
- 🔥 BTCUSDT.P: Liquidation of Highly Leveraged Longs
- 🌊 SOLUSDT.P: SOL's Dip - Your Opportunity
- 🐸 1000PEPEUSDT.P: Prime Bounce Zone Unlocked
- 🚀 ETHUSDT.P: Set to Explode - Don't Miss This Game Changer
- 🤖 IQUSDT: Smart Plan
- ⚡️ PONDUSDT: A Trade Not Taken Is Better Than a Losing One
- 💼 STMXUSDT: 2 Buying Areas
- 🐢 TURBOUSDT: Buy Zones and Buyer Presence
- 🌍 ICPUSDT.P: Massive Upside Potential | Check the Trade Update For Seeing Results
- 🟠 IDEXUSDT: Spot Buy Area | %26 Profit if You Trade with MSB
- 📌 USUALUSDT: Buyers Are Active + %70 Profit in Total
- 🌟 FORTHUSDT: Sniper Entry +%26 Reaction
- 🐳 QKCUSDT: Sniper Entry +%57 Reaction
- 📊 BTC.D: Retest of Key Area Highly Likely
- 📊 XNOUSDT %80 Reaction with a Simple Blue Box!
- 📊 BELUSDT Amazing %120 Reaction!
I stopped adding to the list because it's kinda tiring to add 5-10 charts in every move but you can check my profile and see that it goes on..
Professional Day Trader
Microstructure Practicioner
t.me/umuttrades
kick.com/umuttrades live everyday.
Microstructure Practicioner
t.me/umuttrades
kick.com/umuttrades live everyday.
Related publications
Disclaimer
The information and publications are not meant to be, and do not constitute, financial, investment, trading, or other types of advice or recommendations supplied or endorsed by TradingView. Read more in the Terms of Use.