Here is the top-down analysis for Sei as requested 🫡
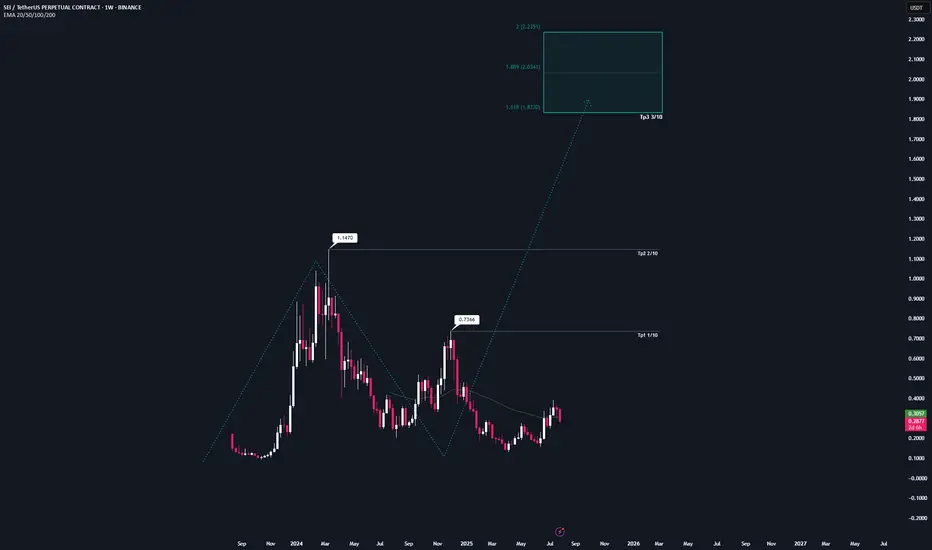
Weekly Timeframe:
We have a potential large structure forming on the weekly chart that will be activated once we break the ATH. Its target zone lies between $1.8 and $2.2.
My sell targets for SEI this cycle are:
TP1: $0.73
TP2: $1.14
TP3: $1.83
These are my sell targets based on my technical analysis. However, I won’t rely on them alone — I also follow several on-chain indicators. Once retail euphoria kicks in and my indicators trigger, I’ll start selling accordingly.

Daily chart:
On the daily, we have a sequence that has already been activated and almost reached its target zone. That’s why the B–C correction level remains a valid buy zone, which I’ll also use for additional long entries.
This would be the second attempt from a B–C correction level, as we’ve already tapped it once (where I went long) and I’ll be entering again here.
Target zone for this sequence: $0.39–$0.44

Local Price action:
On the lower timeframe, we’ve just completed a bearish structure that perfectly overlaps with the B–C correction level. This increases the probability of this setup significantly, as both sides (bulls and bears) want the same thing here: bulls are buying the market, while bears are covering shorts and taking profits.

-----
Thats the my full Analysis for SEI, hope it was helpful if you want me to do another analysis for any other pair just comment down below.
Also, if anyone is interested in how my trading system works, let me know and I’ll post some educational content about it.
Thanks for reading❤️
Weekly Timeframe:
We have a potential large structure forming on the weekly chart that will be activated once we break the ATH. Its target zone lies between $1.8 and $2.2.
My sell targets for SEI this cycle are:
TP1: $0.73
TP2: $1.14
TP3: $1.83
These are my sell targets based on my technical analysis. However, I won’t rely on them alone — I also follow several on-chain indicators. Once retail euphoria kicks in and my indicators trigger, I’ll start selling accordingly.
Daily chart:
On the daily, we have a sequence that has already been activated and almost reached its target zone. That’s why the B–C correction level remains a valid buy zone, which I’ll also use for additional long entries.
This would be the second attempt from a B–C correction level, as we’ve already tapped it once (where I went long) and I’ll be entering again here.
Target zone for this sequence: $0.39–$0.44
Local Price action:
On the lower timeframe, we’ve just completed a bearish structure that perfectly overlaps with the B–C correction level. This increases the probability of this setup significantly, as both sides (bulls and bears) want the same thing here: bulls are buying the market, while bears are covering shorts and taking profits.
-----
Thats the my full Analysis for SEI, hope it was helpful if you want me to do another analysis for any other pair just comment down below.
Also, if anyone is interested in how my trading system works, let me know and I’ll post some educational content about it.
Thanks for reading❤️
Disclaimer
The information and publications are not meant to be, and do not constitute, financial, investment, trading, or other types of advice or recommendations supplied or endorsed by TradingView. Read more in the Terms of Use.
Disclaimer
The information and publications are not meant to be, and do not constitute, financial, investment, trading, or other types of advice or recommendations supplied or endorsed by TradingView. Read more in the Terms of Use.