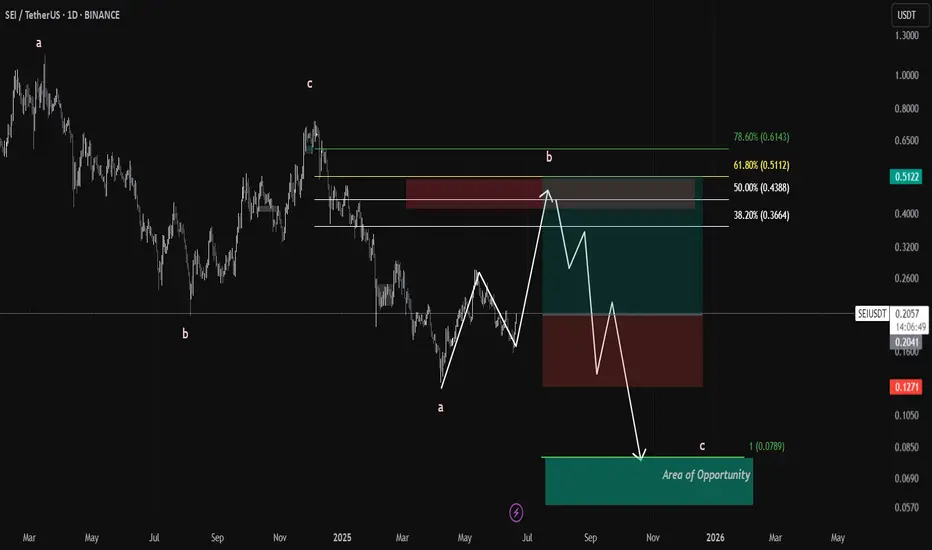
SEI/USDT – Bearish Zigzag Correction In Play | Waiting for the Final Leg C
📉 Current Structure:
The chart displays a developing A-B-C zigzag correction.
Wave a is complete, and price is currently unfolding wave b, pushing into a key supply zone between 0.4388 – 0.5112 USDT.
This zone also aligns with major Fibonacci retracements:
🟡 50% at 0.4388 TP1
🟢 61.8% at 0.5112 TP 2
🔵 78.6% at 0.6143 (max deviation before invalidation) TP3 if given
traders can trade the wave b I have marked the entry and Sl it's a 4RR high probability setup
Targets for Wave C:
🎯 Primary Target (1.0 extension): 0.0789 USDT
Disclaimer
The information and publications are not meant to be, and do not constitute, financial, investment, trading, or other types of advice or recommendations supplied or endorsed by TradingView. Read more in the Terms of Use.
Disclaimer
The information and publications are not meant to be, and do not constitute, financial, investment, trading, or other types of advice or recommendations supplied or endorsed by TradingView. Read more in the Terms of Use.
