Trend :
Indicators :
Key Support and Resistance Levels :
Possible Scenarios :
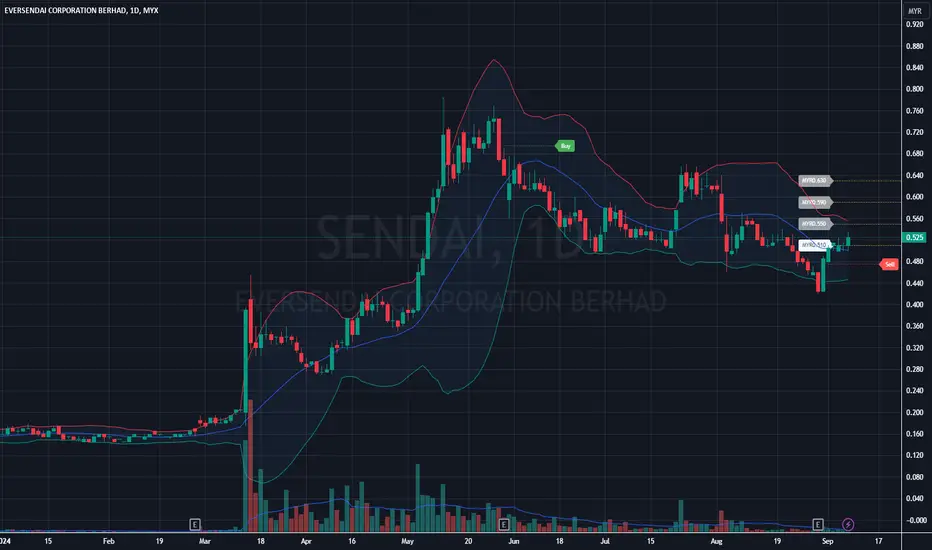
- Current Situation: The recent price action shows a slight rebound from the lows, with price pushing above the moving average.
Indicators :
- Bollinger Bands : The price is currently touching the middle of the Bollinger Bands. This usually indicates that the stock is in a neutral zone after rebounding from the lower band. The upper and lower bands suggest a period of volatility expansion earlier, but currently, the bands are contracting, indicating a period of low volatility or consolidation.
Key Support and Resistance Levels :
- Resistance: Around MYR0.60 (past peak levels from July and early August).
- Support: Around MYR0.480 (recent low in early September), also aligning with the lower Bollinger Band.
Possible Scenarios :
- Bullish Case: If the price continues to rise above the moving average and heads toward the upper Bollinger Band, breaking the resistance around MYR0.60, there could be a potential move higher toward MYR0.65 and beyond.
- Bearish Case: If the price fails to sustain above the moving average and breaks below MYR0.50, it may retest the recent low of MYR0.480 or lower.
Trade active
➀➁➂➃➄
Disclaimer
The information and publications are not meant to be, and do not constitute, financial, investment, trading, or other types of advice or recommendations supplied or endorsed by TradingView. Read more in the Terms of Use.
➀➁➂➃➄
Disclaimer
The information and publications are not meant to be, and do not constitute, financial, investment, trading, or other types of advice or recommendations supplied or endorsed by TradingView. Read more in the Terms of Use.