Case Study - EVERSENDAI CORPORATION BERHAD
Eversendai Corporation Berhad (ECB), formerly Eversendai Corporation Sdn. Bhd is an investment holding company.
The Company's principal activity is the provision of management services. ECB's subsidiaries include EV Abu Dhabi, EV Dubai, EV India, EV Qatar, EVSC, EV Saudi, EV Sharjah, EV Singapore and SEVM. The Company owns 49% interest in EV Abu Dhabi, EV Dubai, EV Qatar and EVSC.
ECB provides some technical services, such as Structural design, Detailing works, Unfolding drawings and Value engineering services. It provides complete design services ranging from conceptual stage design to connection design for a range of structures using appropriate software.
ECB also provides structural detailing works services and services in unfolding drawings with 3-D curvatures for complex structures. The Company has completed over 100 projects, including projects in 10 countries, such as Malaysia, Thailand, Philippines, Indonesia, Hong Kong, Oman, Saudi Arabia, Bahrain, Qatar and UAE.
Analysis of Eversendai Corporation Berhad (SEND) Chart
1. General Trend Overview:
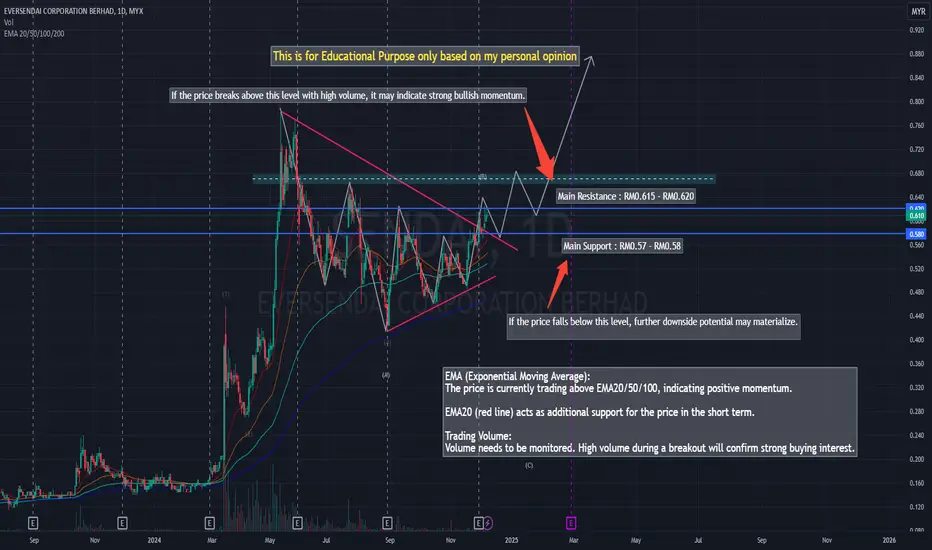
SENDAI 's stock price is showing a symmetric triangle pattern, which is a consolidation pattern.
A breakout above the resistance line may signal an upward movement, while a breakdown below the support line could lead to further price declines.
2. Key Support and Resistance Levels:
Main Resistance: The upper line around RM0.615-RM0.620.
If the price breaks above this level with high volume, it may indicate strong bullish momentum.
Support Level: The ascending lower trendline around RM0.57-RM0.58.
If the price falls below this level, further downside potential may materialize.
3. Technical Indicators:
EMA (Exponential Moving Average):
The price is currently trading above EMA20/50/100, indicating positive momentum.
EMA20 (red line) acts as additional support for the price in the short term.
Trading Volume:
Volume needs to be monitored. High volume during a breakout will confirm strong buying interest.
4. Stock Price Direction:
Positive Scenario:
If the price breaks above RM0.620 with high volume, the next target could be around RM0.65 or higher.
Negative Scenario:
If the price fails to hold above the support level of RM0.57, the stock may decline to lower levels, such as RM0.55 or below.
5. Recommendations:
Buy After Breakout:
Wait for the price to break above RM0.620 with significant volume before entering.
Monitor Support:
If the price drops below RM0.57, consider exiting to avoid further losses.
Set a Stop-Loss:
Place a stop-loss below the support level of RM0.57 to manage risk.
Conclusion: The SENDAI price is in a consolidation phase.
Wait for confirmation of a breakout above resistance or a breakdown below support before making a decision.
The short-term direction depends on how the price behaves around the RM0.620 resistance and RM0.57 support levels.
Eversendai Corporation Berhad (ECB), formerly Eversendai Corporation Sdn. Bhd is an investment holding company.
The Company's principal activity is the provision of management services. ECB's subsidiaries include EV Abu Dhabi, EV Dubai, EV India, EV Qatar, EVSC, EV Saudi, EV Sharjah, EV Singapore and SEVM. The Company owns 49% interest in EV Abu Dhabi, EV Dubai, EV Qatar and EVSC.
ECB provides some technical services, such as Structural design, Detailing works, Unfolding drawings and Value engineering services. It provides complete design services ranging from conceptual stage design to connection design for a range of structures using appropriate software.
ECB also provides structural detailing works services and services in unfolding drawings with 3-D curvatures for complex structures. The Company has completed over 100 projects, including projects in 10 countries, such as Malaysia, Thailand, Philippines, Indonesia, Hong Kong, Oman, Saudi Arabia, Bahrain, Qatar and UAE.
Analysis of Eversendai Corporation Berhad (SEND) Chart
1. General Trend Overview:
SENDAI 's stock price is showing a symmetric triangle pattern, which is a consolidation pattern.
A breakout above the resistance line may signal an upward movement, while a breakdown below the support line could lead to further price declines.
2. Key Support and Resistance Levels:
Main Resistance: The upper line around RM0.615-RM0.620.
If the price breaks above this level with high volume, it may indicate strong bullish momentum.
Support Level: The ascending lower trendline around RM0.57-RM0.58.
If the price falls below this level, further downside potential may materialize.
3. Technical Indicators:
EMA (Exponential Moving Average):
The price is currently trading above EMA20/50/100, indicating positive momentum.
EMA20 (red line) acts as additional support for the price in the short term.
Trading Volume:
Volume needs to be monitored. High volume during a breakout will confirm strong buying interest.
4. Stock Price Direction:
Positive Scenario:
If the price breaks above RM0.620 with high volume, the next target could be around RM0.65 or higher.
Negative Scenario:
If the price fails to hold above the support level of RM0.57, the stock may decline to lower levels, such as RM0.55 or below.
5. Recommendations:
Buy After Breakout:
Wait for the price to break above RM0.620 with significant volume before entering.
Monitor Support:
If the price drops below RM0.57, consider exiting to avoid further losses.
Set a Stop-Loss:
Place a stop-loss below the support level of RM0.57 to manage risk.
Conclusion: The SENDAI price is in a consolidation phase.
Wait for confirmation of a breakout above resistance or a breakdown below support before making a decision.
The short-term direction depends on how the price behaves around the RM0.620 resistance and RM0.57 support levels.
Disclaimer
The information and publications are not meant to be, and do not constitute, financial, investment, trading, or other types of advice or recommendations supplied or endorsed by TradingView. Read more in the Terms of Use.
Disclaimer
The information and publications are not meant to be, and do not constitute, financial, investment, trading, or other types of advice or recommendations supplied or endorsed by TradingView. Read more in the Terms of Use.