🧾 Basic Market Overview
Open: ~80,135
High: ~80,177
Low: ~79,513
Close: ~79,698
Net Change: Down by approximately -437 points or -0.55%
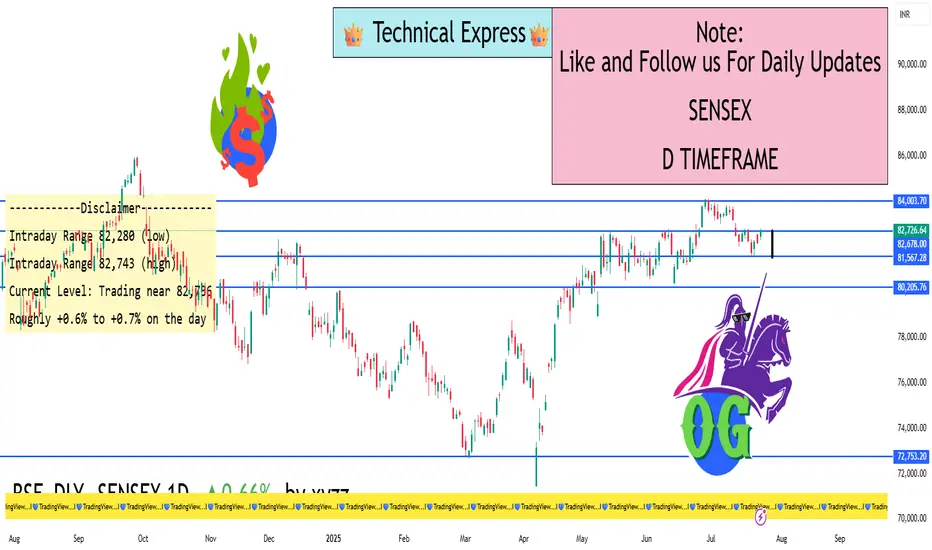
The SENSEX index opened slightly positive today but faced strong resistance near the 80,200 level and then reversed sharply during the session. It closed lower than the opening, indicating bearish pressure.
🕯️ Candlestick Analysis
Today’s candlestick is bearish, forming something close to a bearish engulfing or long red candle. It:
Opened higher than yesterday’s close
Rejected higher levels
Closed near the bottom of the day’s range
This suggests supply pressure and profit-booking near the all-time high zone.
📈 Trend & Structure
Short-Term: Weakening; showing signs of reversal
Medium-Term: Still bullish, but cautious near highs
Long-Term: Uptrend still intact (higher highs and higher lows)
The index is currently facing a resistance zone around 80,200–80,300. This is a psychological and technical barrier.
📌 Sector-wise Observation
Banks (ICICI, HDFC Bank): Weak today; contributed to downside
Reliance: Also showed weakness; contributed to fall
IT Sector: Mixed performance; Infosys held flat
FMCG and Pharma: Stable or slightly positive
Major drag came from financials and heavyweight Reliance.
📉 Price Action Summary
SENSEX failed to hold above 80,000, showing resistance
Sellers active at higher levels
First signs of minor distribution phase near the top
May now move into short-term correction or consolidation
🔮 Possible Scenarios Ahead
✅ Bullish Case:
If Sensex can reclaim and hold above 80,200, a breakout rally toward 80,800–81,000 is possible
⚠️ Bearish Case:
If it breaks below 79,400, the index could fall to 78,800, which is the 20-day moving average and prior swing support
🔄 Consolidation Case:
If it trades between 79,400–80,200 for a few days, it would be in a range-bound phase, waiting for new cues
🧠 Strategy Suggestions
Intraday Traders: Look for reversals near support/resistance. Volatility likely near 79,500 and 80,200.
Swing Traders: Avoid fresh long positions until SENSEX closes above 80,300. Short only below 79,400.
Investors: Trend is healthy but wait for a correction before adding large-cap positions.
✅ Conclusion
SENSEX on July 23, 2025, showed clear signs of resistance at 80,200 and closed lower. Although the broader trend remains intact, today’s action hints at short-term profit booking and potential consolidation.
Be watchful of the 79,400–79,500 support zone tomorrow. A break below this could trigger further weakness, while holding above it could stabilize the index.
Open: ~80,135
High: ~80,177
Low: ~79,513
Close: ~79,698
Net Change: Down by approximately -437 points or -0.55%
The SENSEX index opened slightly positive today but faced strong resistance near the 80,200 level and then reversed sharply during the session. It closed lower than the opening, indicating bearish pressure.
🕯️ Candlestick Analysis
Today’s candlestick is bearish, forming something close to a bearish engulfing or long red candle. It:
Opened higher than yesterday’s close
Rejected higher levels
Closed near the bottom of the day’s range
This suggests supply pressure and profit-booking near the all-time high zone.
📈 Trend & Structure
Short-Term: Weakening; showing signs of reversal
Medium-Term: Still bullish, but cautious near highs
Long-Term: Uptrend still intact (higher highs and higher lows)
The index is currently facing a resistance zone around 80,200–80,300. This is a psychological and technical barrier.
📌 Sector-wise Observation
Banks (ICICI, HDFC Bank): Weak today; contributed to downside
Reliance: Also showed weakness; contributed to fall
IT Sector: Mixed performance; Infosys held flat
FMCG and Pharma: Stable or slightly positive
Major drag came from financials and heavyweight Reliance.
📉 Price Action Summary
SENSEX failed to hold above 80,000, showing resistance
Sellers active at higher levels
First signs of minor distribution phase near the top
May now move into short-term correction or consolidation
🔮 Possible Scenarios Ahead
✅ Bullish Case:
If Sensex can reclaim and hold above 80,200, a breakout rally toward 80,800–81,000 is possible
⚠️ Bearish Case:
If it breaks below 79,400, the index could fall to 78,800, which is the 20-day moving average and prior swing support
🔄 Consolidation Case:
If it trades between 79,400–80,200 for a few days, it would be in a range-bound phase, waiting for new cues
🧠 Strategy Suggestions
Intraday Traders: Look for reversals near support/resistance. Volatility likely near 79,500 and 80,200.
Swing Traders: Avoid fresh long positions until SENSEX closes above 80,300. Short only below 79,400.
Investors: Trend is healthy but wait for a correction before adding large-cap positions.
✅ Conclusion
SENSEX on July 23, 2025, showed clear signs of resistance at 80,200 and closed lower. Although the broader trend remains intact, today’s action hints at short-term profit booking and potential consolidation.
Be watchful of the 79,400–79,500 support zone tomorrow. A break below this could trigger further weakness, while holding above it could stabilize the index.
Hello Guys ..
WhatsApp link- wa.link/d997q0
Email - techncialexpress@gmail.com ...
Script Coder/Trader//Investor from India. Drop a comment or DM if you have any questions! Let’s grow together!
WhatsApp link- wa.link/d997q0
Email - techncialexpress@gmail.com ...
Script Coder/Trader//Investor from India. Drop a comment or DM if you have any questions! Let’s grow together!
Related publications
Disclaimer
The information and publications are not meant to be, and do not constitute, financial, investment, trading, or other types of advice or recommendations supplied or endorsed by TradingView. Read more in the Terms of Use.