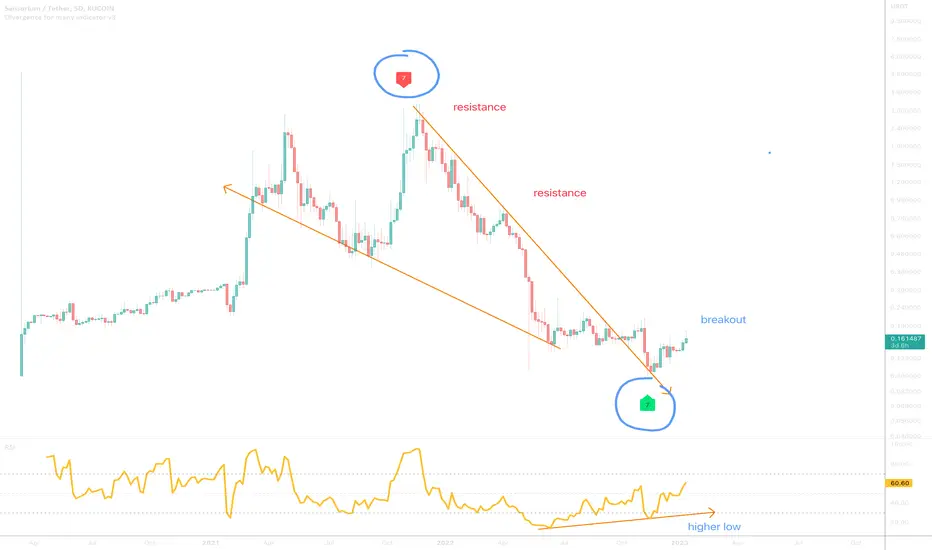
On the above 5-day chart price action has corrected over 90% since the sell signal in November 2021 (not shown). A number of reasons now exist to be long, including:
1) A strong buy signal prints (not shown).
2) Multiple oscillators (blue circles) print positive divergence with price action over a 100 day period. Also true on BTC pair.
3) Price action resistance breakout.
4) Falling wedge breakout forecasts a $3 target.
Is it possible price action falls further? Sure.
Is it probable? No
Ww
Type: trade
Risk: <=6% of portfolio
Timeframe: Don’t know.
Return: 18x / $3
Trade active
Very few alt tokens are printing support on the 200-day SMA. Expect a rapid change in momentum once confirmed.Daily chart
Trade active
Support confirmedNote
on supportBTC
bc1q2eckdzh0q8vsd7swcc8et6ze7s99khhxyl7zwy
Weblink: patreon.com/withoutworries
Allow 3-6 months on ideas. Not investment advice. DYOR
bc1q2eckdzh0q8vsd7swcc8et6ze7s99khhxyl7zwy
Weblink: patreon.com/withoutworries
Allow 3-6 months on ideas. Not investment advice. DYOR
Related publications
Disclaimer
The information and publications are not meant to be, and do not constitute, financial, investment, trading, or other types of advice or recommendations supplied or endorsed by TradingView. Read more in the Terms of Use.
BTC
bc1q2eckdzh0q8vsd7swcc8et6ze7s99khhxyl7zwy
Weblink: patreon.com/withoutworries
Allow 3-6 months on ideas. Not investment advice. DYOR
bc1q2eckdzh0q8vsd7swcc8et6ze7s99khhxyl7zwy
Weblink: patreon.com/withoutworries
Allow 3-6 months on ideas. Not investment advice. DYOR
Related publications
Disclaimer
The information and publications are not meant to be, and do not constitute, financial, investment, trading, or other types of advice or recommendations supplied or endorsed by TradingView. Read more in the Terms of Use.