SHIBUSD – 4H Technical Chart Analysis
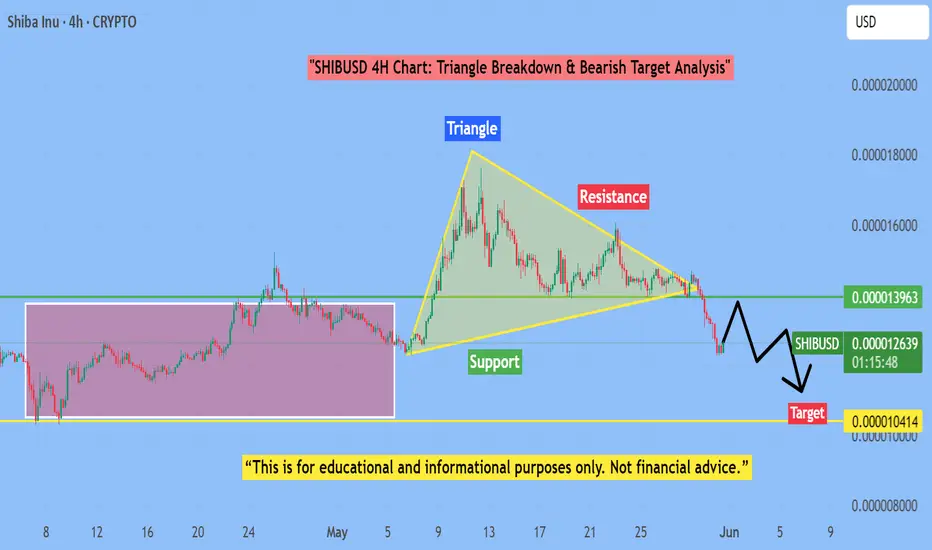
Price recently broke down from a triangle pattern after consolidating near key resistance. A potential retest of the breakdown zone around 0.00001396 is possible before continuing toward the support level near 0.00001041.
Major levels:
🔹 Resistance: 0.00001396
🔹 Support/Target Zone: 0.00001041
The chart highlights structure zones, support/resistance, and triangle pattern behavior on the 4-hour timeframe.
🟡 This content is for educational and informational purposes only. It does not constitute financial advice or a trading recommendation. Always DYOR (Do Your Own Research).
FX|GOLD|CRYPTO| Clean Charts, Sniper Signals & Smart Risk Management. Telegram t.me/smarttrading072
Disclaimer
The information and publications are not meant to be, and do not constitute, financial, investment, trading, or other types of advice or recommendations supplied or endorsed by TradingView. Read more in the Terms of Use.