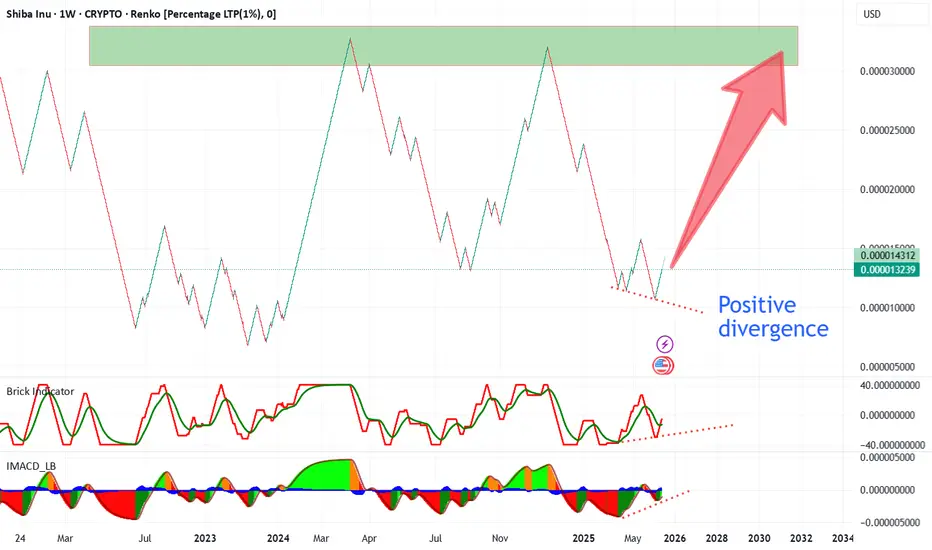
Positive divergence detected!
On the weekly SHIBUSD chart (Renko, %), we see a clear positive divergence between price action and both the Brick Indicator and MACD. While the price printed new lows, momentum indicators are forming higher lows, suggesting fading bearish pressure and a possible reversal ahead.
Key Resistance / Target:
The main resistance zone is at 0.000032 USD (highlighted in green on the chart). This level marks a strong supply area from previous cycles and serves as a potential upside target if the bullish momentum continues.
Summary:
Positive divergence on momentum indicators is confirmed.
Bearish trend is losing strength; reversal potential is increasing.
Next key target is the 0.000032 USD resistance area.
⚠️ This analysis is for informational purposes only and is not financial advice. Always DYOR before trading.
For more of my on-chain analyses, visit my CryptoQuant profile:
cryptoquant.com/profile/u/CryptoOnchain?tab=quicktake
cryptoquant.com/profile/u/CryptoOnchain?tab=quicktake
Disclaimer
The information and publications are not meant to be, and do not constitute, financial, investment, trading, or other types of advice or recommendations supplied or endorsed by TradingView. Read more in the Terms of Use.