---- Mid-term Analysis for the next coming 4 weeks to 3 months - Daily on Daily Chart (LOG)-------
SHIB/USDT: Bullish reversal on going
Context
The Global Crypto market leads by BTC and ETH is still evolving within a bearish market configuration. Like the others digital asset Shiba Inu (SHIB) is suffering about negative global market situation, and with a massive total supply of 1,000,000,000,000,000 (55% of the supply in circulation) it is hard to see a fondamental bullish pressure to be set from the supply management.
Main ressources
Coin Market cap (Supply) =>coinmarketcap.com/currencies/shiba-inu/
Shiba Token (Website) = > shibatoken.com/
Market configuration
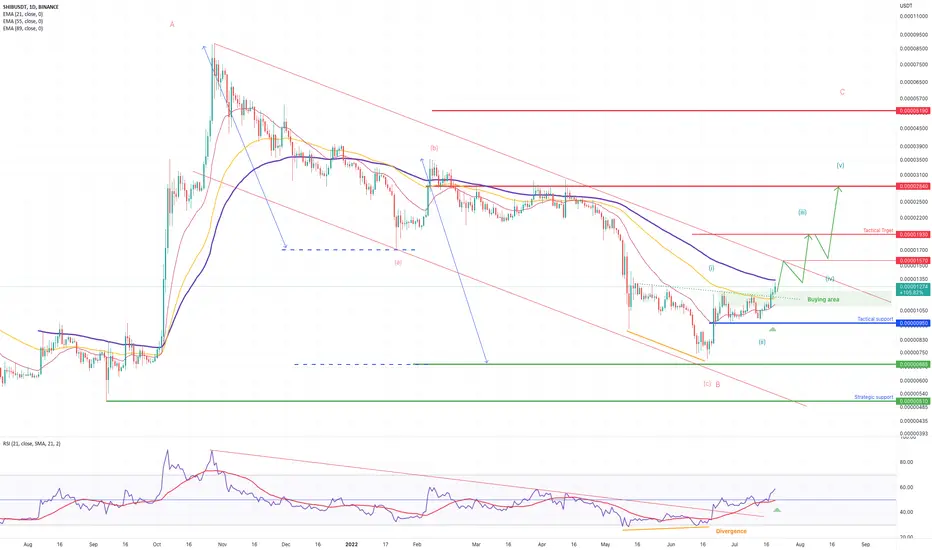
- Graphical Elements :
Graphical Resistance = 0,00001570/1930 & 0,00002840
Graphical Support = 0,00000950
- Mathematical Indicators:
EMA ( Exp Moving averages) are support = Bullish
RSI indicator (below) is reintegrating 50% = Bullish
- Elliot & Harmonic Wave (Fibonacci):
Fibonacci Target c B hasn't been already reached = 0,00000685
Fibonacci support of the wave (ii) = 0,00000950
Fibonacci Bullish Target = 0,00001930 & 0,00002840
Conclusion
Prefered case => As long as 0,00000950 remains support a further rise towards the upper part of the bearish channel at 0,00001570 before 0,00001930. After having reached those target a larger rise will be confirmed
SHIB/USDT: Bullish reversal on going
Context
The Global Crypto market leads by BTC and ETH is still evolving within a bearish market configuration. Like the others digital asset Shiba Inu (SHIB) is suffering about negative global market situation, and with a massive total supply of 1,000,000,000,000,000 (55% of the supply in circulation) it is hard to see a fondamental bullish pressure to be set from the supply management.
Main ressources
Coin Market cap (Supply) =>coinmarketcap.com/currencies/shiba-inu/
Shiba Token (Website) = > shibatoken.com/
Market configuration
- Graphical Elements :
Graphical Resistance = 0,00001570/1930 & 0,00002840
Graphical Support = 0,00000950
- Mathematical Indicators:
EMA ( Exp Moving averages) are support = Bullish
RSI indicator (below) is reintegrating 50% = Bullish
- Elliot & Harmonic Wave (Fibonacci):
Fibonacci Target c B hasn't been already reached = 0,00000685
Fibonacci support of the wave (ii) = 0,00000950
Fibonacci Bullish Target = 0,00001930 & 0,00002840
Conclusion
Prefered case => As long as 0,00000950 remains support a further rise towards the upper part of the bearish channel at 0,00001570 before 0,00001930. After having reached those target a larger rise will be confirmed
CIO & Head of market research (Automata - Vancelian)
vancelian.com/en
vancelian.com/en
Disclaimer
The information and publications are not meant to be, and do not constitute, financial, investment, trading, or other types of advice or recommendations supplied or endorsed by TradingView. Read more in the Terms of Use.