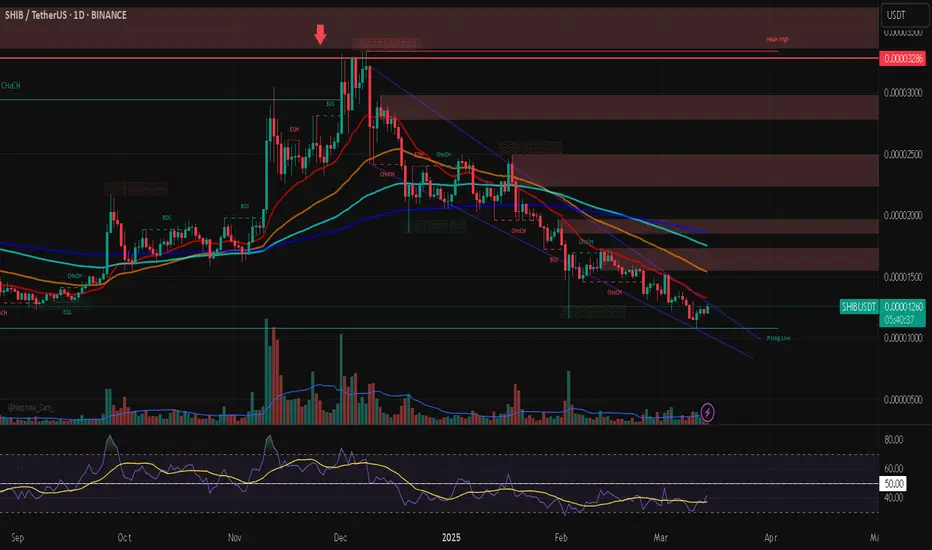
The chart you shared is a daily time frame analysis of SHIB/USDT on Binance. Here are some key observations:
1. Price Action:
The price is in a downtrend, forming lower highs and lower lows.
It is moving inside a descending channel, with the price currently near the lower boundary.
There are change of character (ChoCH) and break of structure (BOS) points, indicating possible shifts in trend momentum.
2. Support & Resistance:
There is a strong support level around 0.0000100 USDT, marked as "Strong Low."
The resistance levels are indicated by red zones around 0.0000200 - 0.0000328 USDT, with the highest level being labeled as a "Weak High."
The price is currently reacting to a demand zone near the lower boundary of the descending channel.
3. Moving Averages:
The blue (200 EMA), orange (100 EMA), and red (50 EMA) moving averages are above the current price, acting as resistance.
A potential bullish reversal may occur if the price can break above these EMAs.
4. RSI (Relative Strength Index):
The RSI is near the oversold zone (below 50) but appears to be recovering, indicating possible bullish momentum.
A bullish divergence could be forming.
5. Volume:
Volume spikes indicate potential buying interest at lower levels.
A significant increase in volume would confirm a breakout from the descending channel.
Conclusion & Potential Scenarios:
Bullish Scenario: If SHIB breaks out of the descending channel with high volume, we could see a move towards 0.0000150 USDT, followed by 0.0000200 USDT.
Bearish Scenario: If SHIB fails to hold the support around 0.0000100 USDT, it may drop further to lower levels.
Would you like a more detailed breakdown or potential trade setups? 🚀
Disclaimer
The information and publications are not meant to be, and do not constitute, financial, investment, trading, or other types of advice or recommendations supplied or endorsed by TradingView. Read more in the Terms of Use.
Disclaimer
The information and publications are not meant to be, and do not constitute, financial, investment, trading, or other types of advice or recommendations supplied or endorsed by TradingView. Read more in the Terms of Use.