🔎 Chart Context
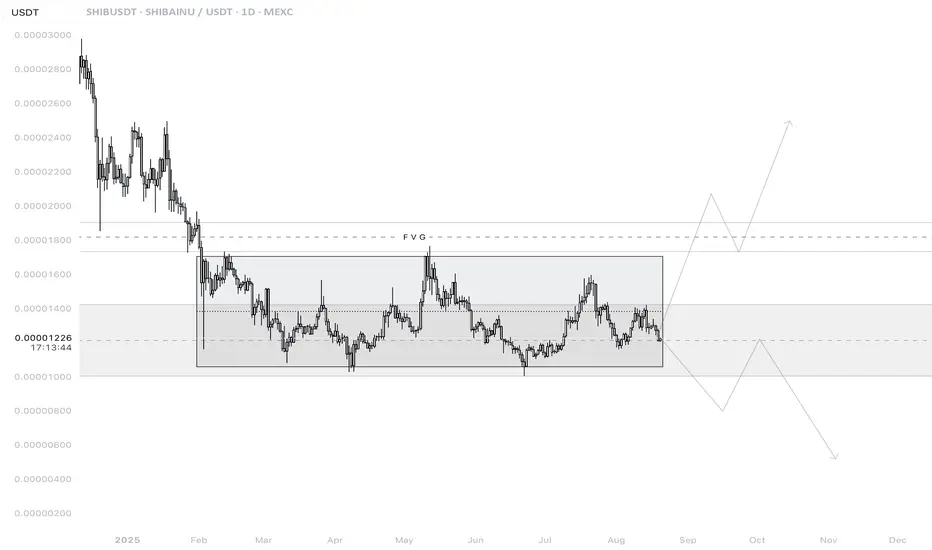
• Pair: SHIB/USDT
• Exchange: MEXC
• Timeframe: 1D (Daily)
• Date: 21 August 2025
This chart shows SHIB trading within a large consolidation range after a significant bearish move earlier in 2025.
📊 Key Observations
1. Macro Structure
• SHIB has been in a sideways range between 0.00001000 (support) and 0.00001597 (resistance) since March 2025.
• The chart highlights this rectangular range, showing repeated liquidity sweeps on both sides.
• Current price: ~0.00001283, sitting in the lower half of the range.
2. Support Zones
• 0.00001160 – 0.00001080 zone: Main demand block, tested multiple times (April, July).
• 0.00001004 – 0.00001028: Deeper liquidity sweep levels; losing this zone risks breakdown.
• These zones are critical for SHIB’s bullish survival.
3. Resistance Zones
• 0.00001362 – 0.00001597 zone: Upper supply boundary of the consolidation.
• 0.00001765 (FVG): Marked upside liquidity gap; a breakout from range would likely target this.
• Beyond that, 0.00001853 – 0.00002000 is the next strong supply zone.
4. Liquidity Behavior
• Below: resting liquidity around 0.00001160 and 0.00001004.
• Above: liquidity pools at 0.00001597 and 0.00001765, making these the primary bullish targets.
• The chart projects both scenarios:
• Bullish breakout above the range toward 0.00001765.
• Bearish breakdown below 0.00001160 toward 0.00001004 or lower.
📈 Bullish Scenario (Higher Probability if 0.00001160 holds)
• SHIB defends 0.00001160 demand and reclaims 0.00001362 mid-range resistance.
• Momentum carries price to:
• TP1: 0.00001597 (range high)
• TP2: 0.00001765 (FVG fill / liquidity sweep)
• TP3 (extension): 0.00001850 – 0.00002000 major supply zone.
• This requires holding above 0.00001160 and rejecting downside liquidity sweeps.
📉 Bearish Scenario (Lower Probability but Risk)
• Price loses 0.00001160 demand with strong volume.
• Next targets:
• 0.00001080 → 0.00001028 (short-term supports)
• 0.00001004 liquidity sweep (major downside magnet)
• A daily close below 0.00001000 confirms a macro bearish breakdown, exposing 0.00000900 and below.
⚡ Trading Plan
• Long Setup (Preferred if support holds):
• Entry: 0.00001160 – 0.00001230 demand zone.
• TP1: 0.00001362
• TP2: 0.00001597
• TP3: 0.00001765
• Stop: Below 0.00001080 or conservative below 0.00001000.
• Short Setup (Only if breakdown confirmed):
• Entry: Retest of 0.00001160 from below.
• TP: 0.00001004 liquidity sweep.
• Stop: Above 0.00001260.
✅ Conclusion
SHIB/USDT Daily is in a consolidation phase between 0.00001000 – 0.00001597.
The most probable scenario is a range-bound accumulation, with bias turning bullish if 0.00001160 holds and price reclaims 0.00001362, targeting 0.00001597 → 0.00001765.
A breakdown below 0.00001160 shifts focus to 0.00001004 liquidity sweep, which would threaten the bullish structure.
Disclaimer
The information and publications are not meant to be, and do not constitute, financial, investment, trading, or other types of advice or recommendations supplied or endorsed by TradingView. Read more in the Terms of Use.
Disclaimer
The information and publications are not meant to be, and do not constitute, financial, investment, trading, or other types of advice or recommendations supplied or endorsed by TradingView. Read more in the Terms of Use.