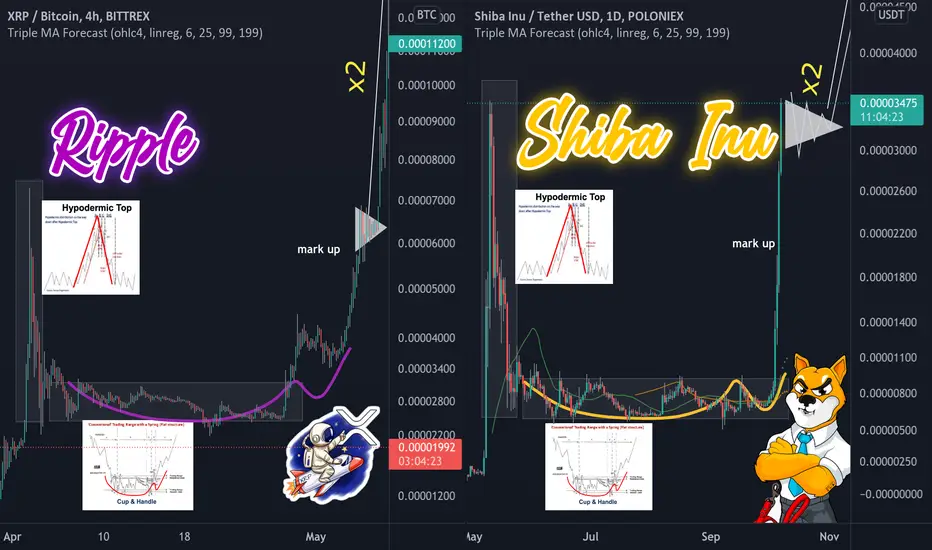
Hey, here is the chart compare between Shiba Inu and Ripple (in 2017)
Both charts look similar and have at least 2 similar shapes.
First let's see Ripple price action and you can find on the left side of the chart — Hypodermic Top, the distribution pattern which

consists of two rapid movements up and down almost on the same price range. Thereafter Price developed the Cup & Handle accumulation range before establishing a new ATH for XRPUSD and XRPBTC.
Now take a look Shiba Inu price action at the right side of the chart — the price on SHIBUSDT appears in the same manner:

Hypodermic Top distribution with Cup & Handle accumulation. Now the price made more than x3 from the accumulation range. What a nice rally.
If we look at development of XRPBTC after accumulation (mark up) you will notice Triangle shape, after which price created new ATH and made at least x2 in a few weeks.
So basically this is what I am expecting from the price of SHIBUSDT during the next couple of weeks — sideways in triangle shape and at least x2 rally. Prices have big room to go.
Anyway guys, this is my research, remember — Markets are always going up and down, so DYOR and trade with affordable risk.
Best regards
Artem Shevelev
Both charts look similar and have at least 2 similar shapes.
First let's see Ripple price action and you can find on the left side of the chart — Hypodermic Top, the distribution pattern which
consists of two rapid movements up and down almost on the same price range. Thereafter Price developed the Cup & Handle accumulation range before establishing a new ATH for XRPUSD and XRPBTC.
Now take a look Shiba Inu price action at the right side of the chart — the price on SHIBUSDT appears in the same manner:
Hypodermic Top distribution with Cup & Handle accumulation. Now the price made more than x3 from the accumulation range. What a nice rally.
If we look at development of XRPBTC after accumulation (mark up) you will notice Triangle shape, after which price created new ATH and made at least x2 in a few weeks.
So basically this is what I am expecting from the price of SHIBUSDT during the next couple of weeks — sideways in triangle shape and at least x2 rally. Prices have big room to go.
Anyway guys, this is my research, remember — Markets are always going up and down, so DYOR and trade with affordable risk.
Best regards
Artem Shevelev
Trade active
Price action on 10min timeframe give opportunity for pullback, be careful there.I am looking for pullback from 2000-ish up to 2800. This is pretty wide range. High volatility for intraday traders. Good luck
📲 Join Telegram Trading Community: t.me/+5hlxWmhHaKplN2Rk
🎙️ 𝘾𝙊𝙈𝙄𝙉𝙂 𝙎𝙊𝙊𝙉 Daily Live Streams on 🔴 𝗬𝗼𝘂𝗧𝘂𝗯𝗲
🔍 linktr.ee/artemcrypto ✅
🎙️ 𝘾𝙊𝙈𝙄𝙉𝙂 𝙎𝙊𝙊𝙉 Daily Live Streams on 🔴 𝗬𝗼𝘂𝗧𝘂𝗯𝗲
🔍 linktr.ee/artemcrypto ✅
Related publications
Disclaimer
The information and publications are not meant to be, and do not constitute, financial, investment, trading, or other types of advice or recommendations supplied or endorsed by TradingView. Read more in the Terms of Use.