Shiba Inu (SHIB) technical analysis:
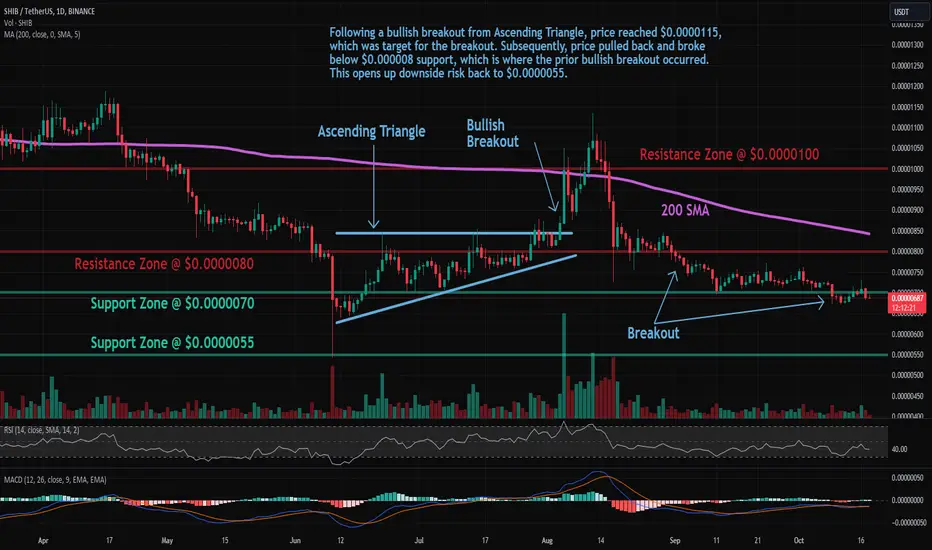
Trade setup: Following a bullish breakout from Ascending Triangle, price reached $0.0000115, which was target for the breakout. Subsequently, price pulled back and broke below $0.000008 support, which is where the prior bullish breakout occurred. This opens up downside risk back to $0.0000055.
Trend: Downtrend across all time horizons (Short- Medium- and Long-Term).
Momentum is Mixed as MACD Line is above MACD Signal Line (Bullish) but RSI < 45 (Bearish).
Support and Resistance: Nearest Support Zone is $0.0000070, which it broke, then $0.0000055. The nearest Resistance Zone is $0.0000080 (previous support), then $0.0000100, and $0.00001200.
Disclaimer
The information and publications are not meant to be, and do not constitute, financial, investment, trading, or other types of advice or recommendations supplied or endorsed by TradingView. Read more in the Terms of Use.
Disclaimer
The information and publications are not meant to be, and do not constitute, financial, investment, trading, or other types of advice or recommendations supplied or endorsed by TradingView. Read more in the Terms of Use.