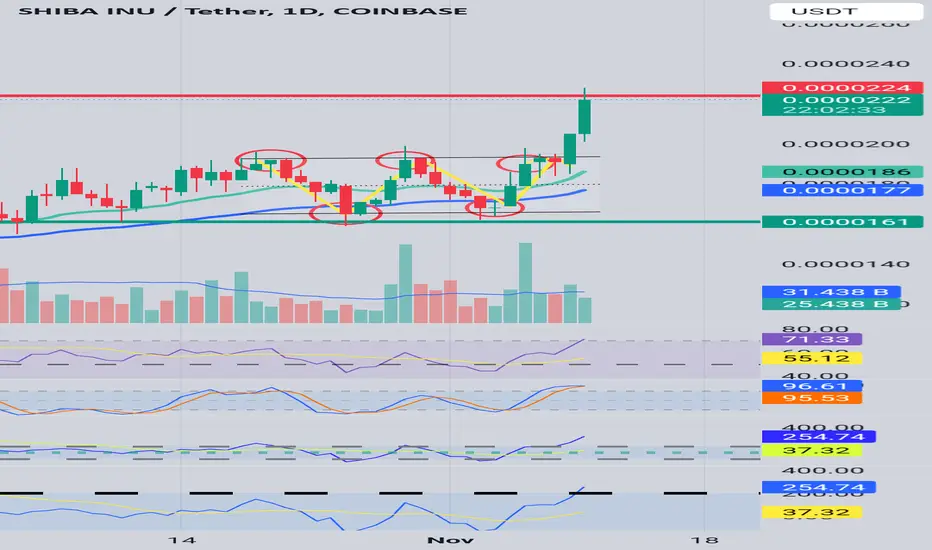
Is the double bottom formation complete even though the day chart candle did not print yet? there is a possibility of a slight pull back, a correction? hypothesizing because of the double bottom and the successful and blessed positive move after that.
Positives- weekly candle is above the 50 EMA
Day candle currently over 21 and 50 EMA
Weekly Chart has cup and handle forming
Negatives- SRSI and RSI and CCI on day chart both indicate asset is overbought. Very close to a key level possible resistance.
Positives- weekly candle is above the 50 EMA
Day candle currently over 21 and 50 EMA
Weekly Chart has cup and handle forming
Negatives- SRSI and RSI and CCI on day chart both indicate asset is overbought. Very close to a key level possible resistance.
Disclaimer
The information and publications are not meant to be, and do not constitute, financial, investment, trading, or other types of advice or recommendations supplied or endorsed by TradingView. Read more in the Terms of Use.
Disclaimer
The information and publications are not meant to be, and do not constitute, financial, investment, trading, or other types of advice or recommendations supplied or endorsed by TradingView. Read more in the Terms of Use.