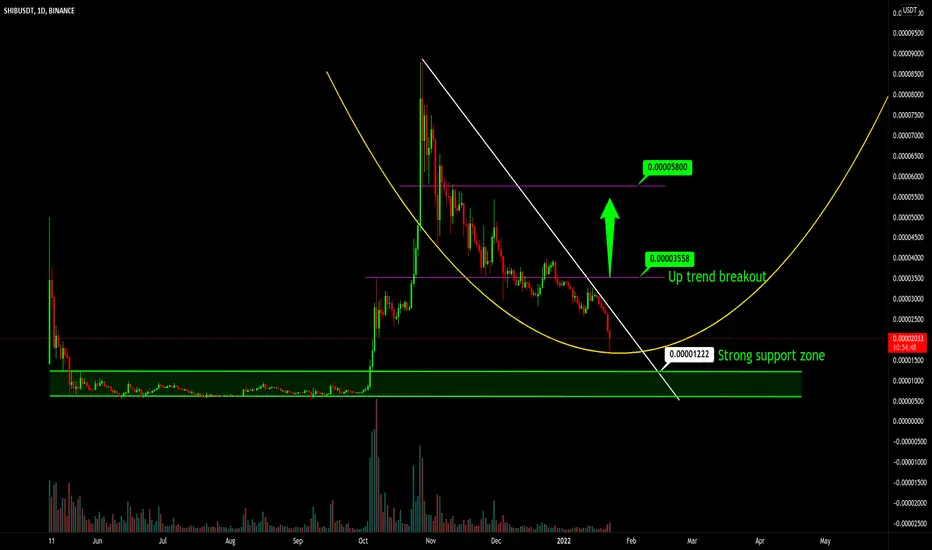
Shibu coin daily chart
SHIBU have strong support near 0.00001222
If you get any reversal sign like hammer candle formation or double bottom use that to buy.
Bullish trend breakout level is 0.00003555 .
SHIBU have strong support near 0.00001222
If you get any reversal sign like hammer candle formation or double bottom use that to buy.
Bullish trend breakout level is 0.00003555 .
Note
12% up in just one day. Enjoy profit.
Disclaimer
The information and publications are not meant to be, and do not constitute, financial, investment, trading, or other types of advice or recommendations supplied or endorsed by TradingView. Read more in the Terms of Use.
Disclaimer
The information and publications are not meant to be, and do not constitute, financial, investment, trading, or other types of advice or recommendations supplied or endorsed by TradingView. Read more in the Terms of Use.