How do you do dear friends,
Mars Signals team wishes you high profits.
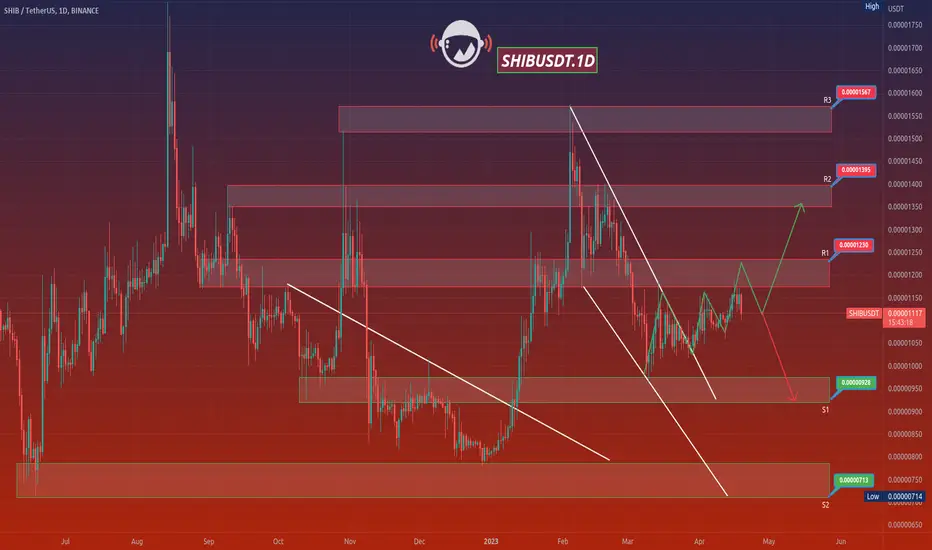
This is a one-day-time frame analysis for SHIBUSDT
There are R3 and R2 on the top of the chart which are the resistance area and both express the unsuccessful triumphs of the price to rise at several points. R1 used to be a support area. And S1 and S2 are our support areas that include the support of price at some points since the past. If we look at the past behavior of the price, we see its rejection at R3 and by experiencing a severe decline, it could be supported at S1 and then start its rising trend up to R1. Hence, we see the fluctuation of price below R1 and our expectation would include another decline and this time the power of its rise would be higher than the past behavior. When the price is supported at its pull back downward, by giving us some rising signs, we must wait for its more increase to higher amounts such as R2. It is possible that the price loses the support and starts a decline toward S1 and even down to our second support area. So in this situation, a falling trend will happen. Please consider the market situation in lower time frames and then decide what to do exactly. We suggest you to save your profits in the resistance areas due to the fact that in the decline of the price, you will not have so much loss. Keep moving with our updates and analyses to have multiple pieces of information and ideas.
Warning: This is just a suggestion and we do not guarantee profits. We advise you to analyze the chart before opening any positions.
Wish you luck
Mars Signals team wishes you high profits.
This is a one-day-time frame analysis for SHIBUSDT
There are R3 and R2 on the top of the chart which are the resistance area and both express the unsuccessful triumphs of the price to rise at several points. R1 used to be a support area. And S1 and S2 are our support areas that include the support of price at some points since the past. If we look at the past behavior of the price, we see its rejection at R3 and by experiencing a severe decline, it could be supported at S1 and then start its rising trend up to R1. Hence, we see the fluctuation of price below R1 and our expectation would include another decline and this time the power of its rise would be higher than the past behavior. When the price is supported at its pull back downward, by giving us some rising signs, we must wait for its more increase to higher amounts such as R2. It is possible that the price loses the support and starts a decline toward S1 and even down to our second support area. So in this situation, a falling trend will happen. Please consider the market situation in lower time frames and then decide what to do exactly. We suggest you to save your profits in the resistance areas due to the fact that in the decline of the price, you will not have so much loss. Keep moving with our updates and analyses to have multiple pieces of information and ideas.
Warning: This is just a suggestion and we do not guarantee profits. We advise you to analyze the chart before opening any positions.
Wish you luck
Disclaimer
The information and publications are not meant to be, and do not constitute, financial, investment, trading, or other types of advice or recommendations supplied or endorsed by TradingView. Read more in the Terms of Use.
Disclaimer
The information and publications are not meant to be, and do not constitute, financial, investment, trading, or other types of advice or recommendations supplied or endorsed by TradingView. Read more in the Terms of Use.