🧠 Overview:
SHIBA/USDT is once again testing a critical support zone that has held strong since early 2022. This area isn’t just a technical level — it represents a long-term accumulation zone where buyers have consistently stepped in.
What happens next could define SHIB's mid to long-term trend. Will we see a major bullish reversal, or is a breakdown and deeper correction looming?
---
📊 Technical Breakdown:
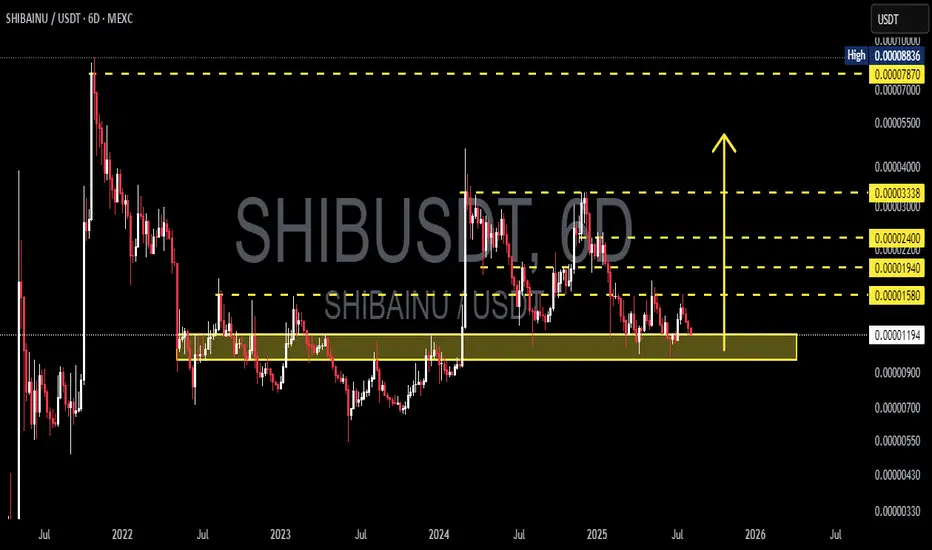
Key Demand Zone (Major Support):
🔸 0.00001090 – 0.00001190 USDT
This zone has been tested multiple times over the past two years. It remains the last major stronghold for bulls. A breakdown here could trigger panic selling.
Important Resistance Levels (Bullish Targets):
🔹 0.00001580 → Initial resistance
🔹 0.00001940 → Previous distribution area
🔹 0.00002400 → Strong psychological level
🔹 0.00003338 → Mid-term bullish target
🔹 0.00007870 – 0.00008836 → High timeframe supply zone and potential long-term profit-taking area
Market Structure:
🔸 Price remains inside a long-term horizontal consolidation range
🔸 No clear breakout yet, but early signs of buyer interest are forming
🔸 Possibility of forming a double bottom or accumulation breakout if bullish momentum strengthens
---
📈 Bullish Scenario:
✅ Price holds above 0.00001190 support
✅ Breakout above 0.00001580 = early trend reversal signal
✅ Bullish confirmation with volume increase
✅ Mid-term targets: 0.00001940 → 0.00002400 → 0.00003338
✅ Long-term potential: Retest of 0.00007870 – 0.00008836 (key supply zone)
---
📉 Bearish Scenario:
❌ Breakdown below 0.00001090 = major bearish signal
❌ Potential drop toward lower zones:
▪️ 0.00000900
▪️ 0.00000700
▪️ 0.00000550 (next key support zone)
❌ Price structure shifts to lower lows, indicating trend weakness and potential distribution phase
---
🧩 Pattern Insights:
📌 Market showing signs of Sideways Accumulation for over 1.5 years
📌 Could be a Re-Accumulation Phase before a major breakout
📌 Current movement resembles a Wyckoff-style Spring, which often precedes an upward expansion
---
📌 Conclusion:
SHIB is standing at a major inflection point. If buyers continue to defend this support zone, it could mark the beginning of a new bullish cycle. However, if this level breaks, further downside is highly likely.
This is a moment of calm before potential volatility — stay alert and watch volume + price action closely.
#SHIB #SHIBUSDT #CryptoBreakout #SupportZone #AltcoinAnalysis #SHIBAInu #TechnicalAnalysis #AccumulationPhase #WyckoffMethod #CryptoBullish #CryptoBearish
SHIBA/USDT is once again testing a critical support zone that has held strong since early 2022. This area isn’t just a technical level — it represents a long-term accumulation zone where buyers have consistently stepped in.
What happens next could define SHIB's mid to long-term trend. Will we see a major bullish reversal, or is a breakdown and deeper correction looming?
---
📊 Technical Breakdown:
Key Demand Zone (Major Support):
🔸 0.00001090 – 0.00001190 USDT
This zone has been tested multiple times over the past two years. It remains the last major stronghold for bulls. A breakdown here could trigger panic selling.
Important Resistance Levels (Bullish Targets):
🔹 0.00001580 → Initial resistance
🔹 0.00001940 → Previous distribution area
🔹 0.00002400 → Strong psychological level
🔹 0.00003338 → Mid-term bullish target
🔹 0.00007870 – 0.00008836 → High timeframe supply zone and potential long-term profit-taking area
Market Structure:
🔸 Price remains inside a long-term horizontal consolidation range
🔸 No clear breakout yet, but early signs of buyer interest are forming
🔸 Possibility of forming a double bottom or accumulation breakout if bullish momentum strengthens
---
📈 Bullish Scenario:
✅ Price holds above 0.00001190 support
✅ Breakout above 0.00001580 = early trend reversal signal
✅ Bullish confirmation with volume increase
✅ Mid-term targets: 0.00001940 → 0.00002400 → 0.00003338
✅ Long-term potential: Retest of 0.00007870 – 0.00008836 (key supply zone)
---
📉 Bearish Scenario:
❌ Breakdown below 0.00001090 = major bearish signal
❌ Potential drop toward lower zones:
▪️ 0.00000900
▪️ 0.00000700
▪️ 0.00000550 (next key support zone)
❌ Price structure shifts to lower lows, indicating trend weakness and potential distribution phase
---
🧩 Pattern Insights:
📌 Market showing signs of Sideways Accumulation for over 1.5 years
📌 Could be a Re-Accumulation Phase before a major breakout
📌 Current movement resembles a Wyckoff-style Spring, which often precedes an upward expansion
---
📌 Conclusion:
SHIB is standing at a major inflection point. If buyers continue to defend this support zone, it could mark the beginning of a new bullish cycle. However, if this level breaks, further downside is highly likely.
This is a moment of calm before potential volatility — stay alert and watch volume + price action closely.
#SHIB #SHIBUSDT #CryptoBreakout #SupportZone #AltcoinAnalysis #SHIBAInu #TechnicalAnalysis #AccumulationPhase #WyckoffMethod #CryptoBullish #CryptoBearish
✅ Get Free Signals! Join Our Telegram Channel Here: t.me/TheCryptoNuclear
✅ Twitter: twitter.com/crypto_nuclear
✅ Join Bybit : partner.bybit.com/b/nuclearvip
✅ Benefits : Lifetime Trading Fee Discount -50%
✅ Twitter: twitter.com/crypto_nuclear
✅ Join Bybit : partner.bybit.com/b/nuclearvip
✅ Benefits : Lifetime Trading Fee Discount -50%
Disclaimer
The information and publications are not meant to be, and do not constitute, financial, investment, trading, or other types of advice or recommendations supplied or endorsed by TradingView. Read more in the Terms of Use.